
I learnt a cool new trick in PowerPoint yesterday. I learnt about merging shapes.
Like Excel, PowerPoint has the ability to draw various shapes into your slides (or sheets in Excel). We can draw lines, arrows, rectangles, circles and many other shapes.
But PowerPoint has an extra feature with shapes that isn’t available in Excel. In PowerPoint, we have the ability to merge shapes together to create new shapes.

We could combine a long skinny rectangle with a star shape to create a magic wand. The Possibilities are endless!

That gave me an idea for a fancy dashboard type visual. So in this post, we’re going to learn how to create a dynamic traffic light that changes colours based on some key performance indicator (KPI) value in our dashboard.
Unlike the magic wand, our traffic light will actually work! When our KPI value changes, our traffic light will change too, depending on what range of values we set it with.
Video Tutorial
Creating A Traffic Light Shape
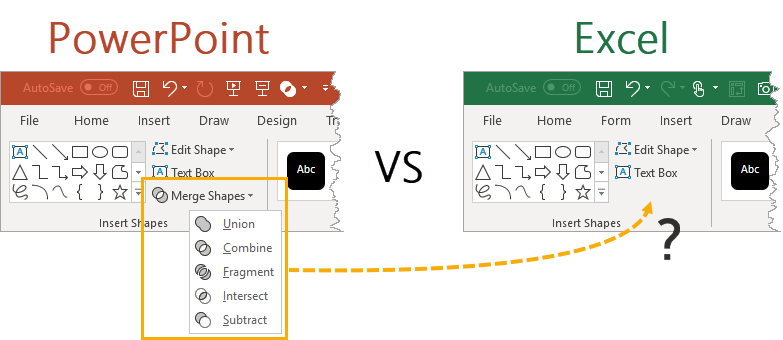
When you add a shape in either PowerPoint or Excel and then select it, a new Drawing Tools Format tab will appear in the ribbon. But in PowerPoint there’s an extra Merge Shapes option that’s just not there in Excel.
There are a lot of hidden commands in Excel that don’t appear in the ribbon tabs, and it’s possible to use them by adding them to the quick access toolbar. But the merge shapes isn’t even found there.
So in order to create our traffic light shape, we need to head into PowerPoint to use the merge shapes options.
Merging Shapes In PowerPoint
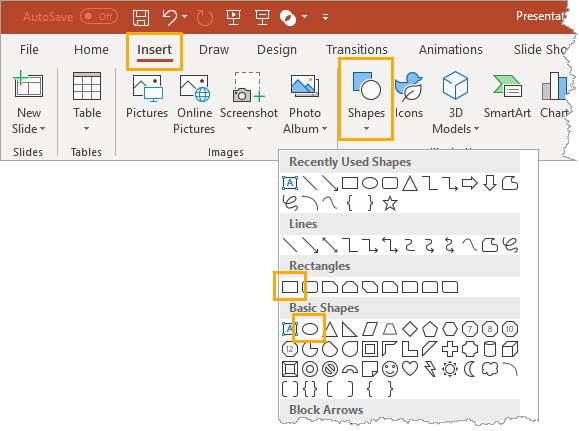
First we will need to add a couple shapes. Add the rectangle shape first, this way it will be layered as the bottom shape.
Then add a circle shape. There is actually no circle shape, only an oval, but we can use this to create a circle. Hold the Shift key while drawing the oval shape to lock the ratio and create a perfect circle.
We can adjust the size as needed so the circle fits nicely inside the rectangle. Then we can copy and paste the circle for a total of three circles.
PowerPoint has a build in alignment tool that will help with aligning all the shapes which is another advantage to doing this part in PowerPoint vs Excel.
We can also use the alignment tools in the Drawing Tools Format tab ➜ Align ➜ Align Center and/or Distribute Vertically.
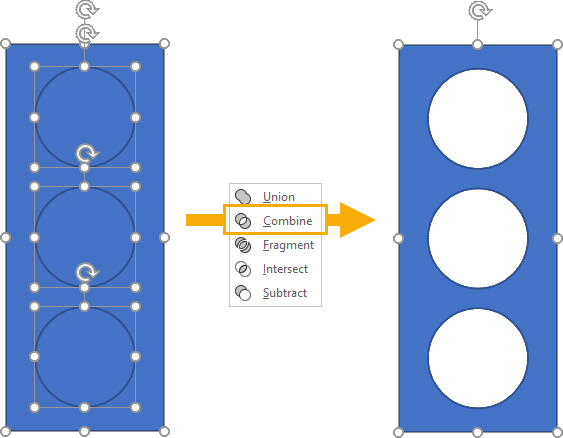
Once we’ve got everything nicely aligned and centered, we are ready to merge the shapes. We can go to the Drawing Tools Format tab ➜ Merge Shapes ➜ Combine. This will essentially cut out the circles from the rectangle and leave us with one shape (a rectangle with three holes in it).
I don’t know any traffic lights that are blue, so we will also change the colour from the default blue.
- Drawing Tools Format tab ➜ Shape Fill then change the colour to a dark grey.
- Drawing Tools Format tab ➜ Shape Outline then change the colour to a black.
Copy and paste this new shape into Excel and we’re done with PowerPoint.
Conditional Format Rules To Change Fill Colour
In this example, our KPI value that drives the traffic light will be in Sheet1 and the behind the scenes stuff that actually makes the lights change will be in Sheet2.
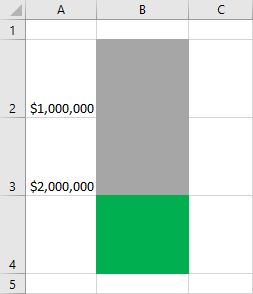
This is the basic set up in Sheet2. In cell A2 and A3 we have some numerical values and in cells B2:B4 there is some conditional formatting based on these values and our KPI.
- When our KPI is less than the value in A2, our traffic light will show red.
- When our KPI is between the values in A2 and A3, our traffic light will show yellow.
- When our KPI is greater than the value in A3, our traffic light will show green.
We will set up conditional formatting in cells B2:B4 to do this.
Before setting up the conditional formatting, we can apply a light grey formatting to the cells in B2:B4. This will be the colour that shows when the traffic light is off.
Cell B2 will be our red light. Select this cell and go to the Home tab ➜ Conditional Formatting ➜ New Rule.
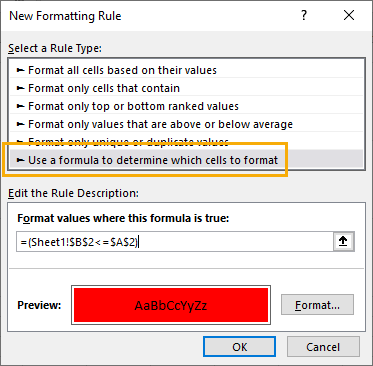
=(Sheet1!$B$2<=$A$2)We will use the formula Rule Type with the above formula and also set the Format to a red fill colour. Here Sheet1!$B$2 is where our KPI value is.
=AND((Sheet1!$B$2>$A$2),(Sheet1!$B$2<=$A$3))In cell B3 we need a similar conditional formatting with the above formula and a yellow fill colour Format.
=(Sheet1!$B$2>$A$3)In cell B4 we need our last conditional formatting with the above formula and a green fill colour Format.
We will also need to re-size the column width and row height of cells B2:B4 so that each cell fits nicely under our rectangle’s holes.
Paste Range As Linked Picture
We are going to use the range of conditionally formatted cells in B2:B4 as the lights for our traffic light visual.
To do this, we are going to use a nifty paste option called Linked Picture. This allows us to create a picture of the cells in B2:B4, but this picture is dynamic and will change when those cells change.
We can copy the range B2:B4 and head over to Sheet1 where our traffic light shape is.
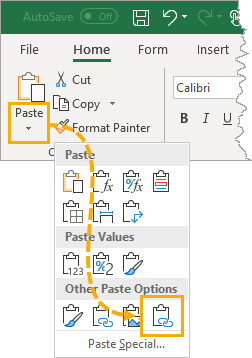
In the Home tab click on the small arrow under the Paste command, then select the Linked Picture option.
Arrange And Group The Shape And Picture
We can re-size the resulting linked picture so that each cell lines up with each hole in our traffic light shape.
Place the linked picture on top of the traffic light shape so that each cell covers each hole but the picture is still smaller than the entire rectangle.
Then we can place the picture behind the shape by going to the Drawing Tools Format tab ➜ Send Backwards ➜ Send to Back.
Once we’re happy with the position of the shape and picture, we can group them together. Drawing Tools Format tab ➜ Group ➜ Group. This will allow us to move and resize the traffic light all as one object.
Now we have a pretty sweet little traffic light visual for our dashboards!
Conclusions
With a little help from PowerPoint, we can combine shapes to make more complex shapes. While Excel doesn’t have these capabilities, we can easily copy the PowerPoint results over to Excel.
We used these new shape creating super powers to cut out some holes in a rectangle. When combined with a linked picture to some conditionally formatted cells, we can create a cool traffic light visual.
What kind visuals might you be able to come up with? Let me know in the comments below!


Thank you – very useful
No problem!