
Do you need to get the quarter from your dates in Excel? This post is going to show you how to extract the calendar quarter from any date value in Excel.
An Excel project may require you to summarize your data by date intervals. One such date interval is the quarter.
A quarter is a three-month interval, so there are four quarters in every year. These are the standard calendar year quarters.
- Quarter 1 includes all dates between January 1st and March 31st.
- Quarter 2 includes all dates between April 1st and June 30th.
- Quarter 3 includes all dates between July 1st and September 30th.
- Quarter 4 includes all dates between October 1st and December 31st.
Quarters are relevant in tasks like financial reporting because a company’s performance is often evaluated for a three-month period. Luckily, Excel supports working with quarterly data in a variety of ways.
How do you extract the quarter from an Excel date?
This blog post explains all the different ways to extract the quarter from an Excel date. You can choose the method best suited to your situation, whether it be formulas, VBA, Power Query, Pivot Table, Power Pivot, or Office Scripts.

Get your copy of the example workbook used in this post to follow along.
Extract the Quarter Using the CHOOSE Function
One way to extract the quarter is by using the CHOOSE function. The CHOOSE function lets you select one value from a list based on an index value.
The idea is to first extract the month from your date, then use this as the index to select the quarter from a list.
= MONTH ( B2 )Suppose your date is in cell B2. Select an empty cell and type the above MONTH function into the formula bar and it will extract the month as a number between 1 and 12.
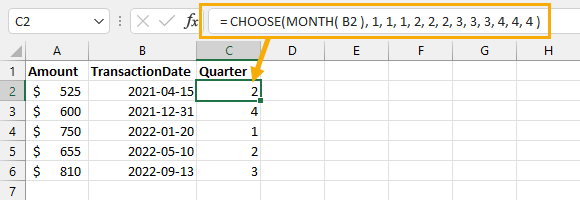
= CHOOSE ( MONTH ( B2 ), 1, 1, 1, 2, 2, 2, 3, 3, 3, 4, 4, 4 )You can then use the result of the MONTH function as the first argument of the CHOOSE function.
The remaining arguments indicate what the quarter would be for each of the twelve possible months, so the remaining arguments are always 1, 1, 1, 2, 2, 2, 3, 3, 3, 4, 4, 4.
- Months 1, 2, and 3 are mapped to quarter 1.
- Months 4, 5, and 6 are mapped to quarter 2.
- Months 7, 8, and 9 are mapped to quarter 3.
- Months 10, 11, and 12 are mapped to quarter 4.
Press Enter to leave the formula bar. In this example, 2 is the correct quarter!
The CHOOSE function is useful when there are a small number of possible values. Because there are only twelve possible months, the CHOOSE function is good for extracting the quarter.
💡 Tip: You can adjust this formula to work for non-calendar year quarters. For example, if your year starts July 1st, you can use 3, 3, 3, 4, 4, 4, 1, 1, 1, 2, 2, 2 for the CHOOSE arguments.
Extract the Quarter Using the ROUNDUP Function
ROUNDUP is another function that you can use to extract the quarter from a date.
This method is concise because it takes advantage of the fixed length of a quarter, as well as integer rounding.

= MONTH ( B2 )Extract the month from your date by selecting an empty cell and typing the MONTH function into the formula bar. This gives you a number between 1 and 12.
= MONTH ( B2 ) / 3Divide that month by the number of months per quarter. The number of months per quarter is always 3, so simply divide by 3.
= ROUNDUP ( MONTH ( B2 ) / 3, 0 )Type the ROUNDUP function to round up the result of the division.
This rounding is necessary in case the month is not an even multiple of 3. For example, April is month 4, but 4 is not an even multiple of 3 because 4 / 3 = 1.333.
By rounding the 1.333 value up to 2, you arrive correctly at quarter 2 for April.
Specify zero 0 for the second argument of ROUNDUP to indicate that you want to round up to the next integer value.
Press Enter to leave the formula bar, and you now have the quarter from your date!
Extract the Quarter Using VBA
If you need to extract quarters from a set of dates and want a static value, you can use VBA rather than functions.
With this method, you can loop through a selected range of dates and extract the quarters into an adjacent range.

To implement this method, open your VBA Editor from Excel by going to the Developer ribbon tab and clicking Visual Basic.
If you don’t have the Developer tab enabled, you can still open the editor by pressing Alt + F11 on your keyboard.
📝 Note: The Developer tab is disabled by default. You can enable the Developer tab if you don’t see it in your Excel ribbon.

Go to the Insert menu and select Module.
This will create a place where you can add your VBA code.

Sub ExtractQuarters()
Dim rng As Range
For Each rng In Selection
    If IsDate(rng.Value) Then
        rng.Offset(0, 1).Value = DatePart("q", rng.Value)
    End If
Next rng
End Sub
Paste the above VBA macro code in the new module.
The code is designed to loop through your selected cell range. If the cell contains a date, the quarter will be extracted into the adjacent cell using the built-in DatePart function.
DatePart extracts the quarter only if you supply the "q" argument. The quarter gets extracted to rng.Offset(0, 1) which is the cell in the adjacent column.

To run the code, go back to your sheet and select your desired cell range of dates.
Then go to the Developer ribbon tab and click Macros to open the Macro dialog box.
You can also use the Alt + F8 keyboard shortcut to open the Macro dialog box.

From the Macro window, select the ExtractQuarters macro, then click Run.

After the macro runs, the quarters appear in the adjacent column!
⚠️ Warning: This code will produce static values and the results won’t update when the dates change. You will need to re-run the macro to update the quarters.
Extract the Quarter Using Power Query
In situations where you need to extract quarters from dates that reside outside Excel, using Power Query is a good method for doing so.
With Power Query, you’ll easily be able to extract the quarters into a new Excel column.
Power Query is available in Excel 2016 and later. If you have an Excel version prior to 2016, you may need to install the free Power Query add-in.

In the above example, the dates reside in a CSV text file called DatedTransactions.csv.

To query this file using Power Query, go to the Excel’s Data ribbon tab, then click From Text/CSV.

Browse for the file, then click Import.
Before Power Query imports the data, a preview window appears. Because you want to add a new column to this data, click Transform Data.

From the Power Query Editor, select your column of dates. Go to the Add Column ribbon tab, then click the Date menu.
📝 Note: The Date menu will be grayed out unless you have a date column selected.

Within the Date menu, go to the Quarter submenu, then select the Quarter of Year submenu.

= Table.AddColumn(#"Changed Type", "Quarter", each Date.QuarterOfYear([TransactionDate]), Int64.Type)Your new Quarter column gets created and contains all the extracted quarters.
Power query will automatically create the above m code formula behind the scene which extracts the quarter values.

To import all these columns into Excel, go to the Home ribbon tab, then click Close & Load.

Power Query imports the entire file, including the extracted quarters, into a new Excel sheet.
That’s all that’s needed for the Power Query method!
💡 Tip: If data in the source file changes, you can easily update the Power Query results. Go to the Data tab and click the Refresh button to refresh the query.
Extract the Quarter Using a Pivot Table
Pivot tables are an easy way to summarize your data in Excel.
They allow you to quickly slice, dice, and aggregate your data in just a few clicks.
Pivot tables work great with dates too! You can summarize your data by grouping dates into years, months, and quarters.

First, you will need to create a pivot table based on your data with the date values.
Select a cell inside your dataset and go to the Insert tab and select the PivotTable command.

This will open up the PivotTable from table or range menu where you will be able to select the location for your new pivot table.
Select either a New Worksheet or Existing Worksheet for the location and press the OK button.
Now you will have a blank pivot table and when you select any cell inside it you should see the PivotTable Fields list appear on the right.

Add your date field into the Rows area of the PivotTable Fields list.
You may notice Excel creates some extra fields for Years, Quarters, and Months.

If the Quarter field doesn’t appear automatically, you can create it by grouping your date field.
Right-click on the date column in your pivot table and select the Group option from the menu.

This will open the Grouping menu and you can select the Quarters option and press the OK button.

The final result in your pivot table is now summarized by quarters!
Extract the Quarter Using a Power Pivot Calculated Column
Power Pivot is an Excel feature that can calculate new columns of values based on your existing data.
Only one DAX Expression formula is needed to calculate the entire column. This makes Power Pivot a powerful method for extracting data.
You will need to ensure that the Power Pivot add-in is activated in your Excel to extract quarters from a column of dates using Power Pivot.

Go to the Developer ribbon tab then click COM Add-ins to activate the Power Pivot add-in from Excel.

Ensure the Microsoft Power Pivot for Excel option is checked inside the COM Add-ins window, then click the OK button.
Power Pivot is now activated!

In the above example, the sheet contains two columns of data. You can create a Power Pivot table from this data.
Select the entire table, then go to the Power Pivot ribbon tab and click on the Add to Data Model command.

If your data is not inside an Excel table, then you will be prompted to create an Excel table.
You can accept the default by clicking the OK button from the Create Table window.

This will open the Power Pivot editor window where you’ll be able to add a new calculated column.
Go to the Design ribbon tab, then click the Add button. This creates a new, empty calculated column for the quarters.
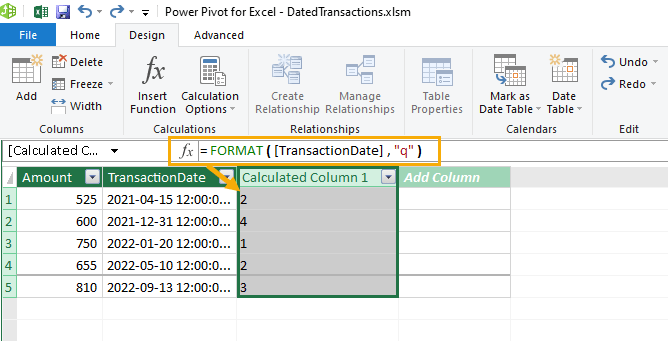
= FORMAT ( [TransactionDate] , "q" )The above formula can be used to calculate the quarter.
This example extracts the quarters from the TransactionDate column. The second argument "q" indicates that the quarter is your desired format result.

Unfortunately, the FORMAT function returns the quarter as a text value. But it might be preferable that the quarter behaves as a number!
You can change the data type of the column so the results are numerical values instead of text.
Select the column and go to the Home tab in the ribbon and then select the Whole Number option from the Data Type dropdown list.
= INT ( FORMAT ( [TransactionDate] , "q" ) )Another option would be to use the above formula to force the data type to a whole number. The INT function will return the integer part of a number and will force the column to a whole number data type in the process.

You can then rename the calculated column to a more intuitive name, like Quarter.
Double left-click the Calculated Column 1 header and rename it to Quarter.
The calculated column is complete!
You can now click on the Save icon in the upper left corner of the power pivot editor and then close the editor.

How can you use this calculated column? It can be used in a PivotTable connected to the data model.
Go to the Insert tab and click on the lower part of the PivotTable command then select From Data Model.

Select a location for your pivot table either as a New Worksheet or an Existing Worksheet then press the OK button.

From the PivotTable Fields pane, you can then expand the table to show the new Quarter field you created.
Drag Quarter to the Rows area and drag Amount to the Values area. The resulting PivotTable demonstrates the total Amount by Quarter.

This PivotTable is a good example of how quarterly data can get presented.
Extract the Quarter Using Office Scripts
Office Scripts is a relatively new way to automate Excel tasks. To create an Office Script, you will need to be using Excel for the web, while logged in under a Microsoft 365 business license.
An Office Script can be constructed to loop through a selected range of dates, extract the quarter, and place the value in an adjacent column.

Open your file in the web browser by signing in to http://www.office.com.
Go to the Automate ribbon tab, then select the New Script menu item.

function main(workbook: ExcelScript.Workbook) {
  /* Extracts quarters from selected range to adjacent column */

  /* Selected range */
  let rng = workbook.getSelectedRange();
  let rows = rng.getRowCount();
  let cols = rng.getColumnCount();
  /* Loop through the cells */
  for (let i = 0; i < rows; i++) {
    for (let j = 0; j < cols; j++) {
      /* Cell date */
      let cell_date = rng.getCell(i, j).getValue() as number;
      /* Convert to Office Scripts date */
      let script_date = OfficeScriptsDate(cell_date);
      /* Extract quarter */
      let currQtr = Qtr(script_date);
      /* Put quarter in adjacent column */
      rng.getCell(i, j + 1).setValue(currQtr);
    };
  };
}
Replace the entire contents of the Code Editor window with the above Office Script code.
This code is the main function, which must be named main to indicate that it will be the first function to run in this Office Script.
The main function will loop through the selected range and extract the quarters into the adjacent column, but this function will need help from two additional pieces of code.
function OfficeScriptsDate(cell_date: number) {
  /* Converts cell date to Office Scripts date */

  /* Days between Jan 1, 1900 and Jan 1, 1970 */
  const days_offset = 25568;
  /* Seconds per day */
  const sec_per_day = 86400;
  /* Milliseconds per second */
  const ms_per_sec = 1000;
  /* Days between Jan 1, 1970 and the cell date */
  var xl_days = Math.floor(cell_date - days_offset);
  /* Convert days to seconds */
  var xl_sec = xl_days * sec_per_day;
  /* Convert seconds to milliseconds and convert to datetime */
  var date_info = new Date(xl_sec * ms_per_sec);
  /* Convert datetime to date-only */
  return new Date(date_info.getFullYear(), date_info.getMonth(), date_info.getDate());
}
Scroll to the bottom of the Code Editor window and append the above code.
This OfficeScriptsDate function will convert a cell date to an Office Scripts date.
An Excel date is actually a number representing the number of days since January 1, 1900. In contrast, Office Scripts uses January 1, 1970 as its starting value. This means there is always a discrepancy of 25,568 days!
Subtracting 25,568 days from the cell date will convert it to an Office Scripts date.
function Qtr(script_date: Date) {
  /* Extracts quarter from date */
  /* Month from date */
  let monthNum = script_date.getMonth();
  /* Quarter from month */
  switch (monthNum) {
    case 0: return 1;  //Jan
    case 1: return 1;  //Feb
    case 2: return 1;  //Mar
    case 3: return 2;  //Apr
    case 4: return 2;  //May
    case 5: return 2;  //Jun
    case 6: return 3;  //Jul
    case 7: return 3;  //Aug
    case 8: return 3;  //Sep
    case 9: return 4;  //Oct
    case 10: return 4;  //Nov
    case 11: return 4;  //Dec
  };
};
Scroll again to the bottom of the Code Editor window and append the above code.
This Qtr function will simply extract the quarter from the date based on its month.
📝 Note: The months start from 0, meaning January is month 0 in Office Scripts!

Select a column of dates then click the Run button in the Office Script Code Editor.

In the above example, column B contains the selected dates. After the code runs, the extracted quarters appear in adjacent column C!
⚠️ Warning: Make sure the adjacent column is empty as the Office Script will overwrite anything in it!
Conclusions
Analyzing and summarizing your data by calendar quarter might be required for your reports. But if you only have a date then you’re going to need to extract the quarter somehow.
Thankfully, there are many ways to get the quarter from your dates.
For a relatively small amount of data, using the CHOOSE or ROUNDUP function is a good choice. Both options will get the task done, but the ROUNDUP formula will be a little more concise.
If you need a static result that won’t change if you edit the dates then the VBA method could be the right choice. But you will need to be comfortable with coding in VBA and the additional security concerns that come with the macro-enabled workbooks.
For large datasets, the Pivot Table or Power Pivot method performs well when you need to summarize the results by quarter. While the Power Query method is particularly suitable when your data is located outside of Excel.
Extracting the quarter using Office Scripts may be superior if you’re working in a web-only Office environment.
Do you use any of these methods for getting the quarter from your dates? Do you know any other methods? Let me know in the comments below!


Can you get me a date for a quarter? 🙂
I think you would need a time machine to get any decent purchasing power with a quarter 😁