
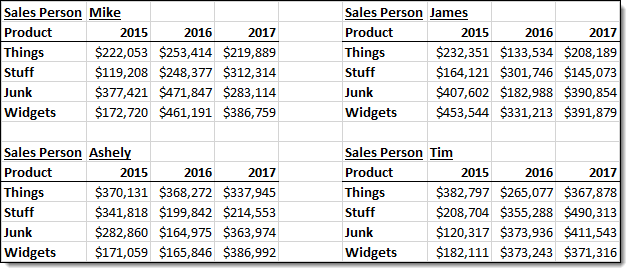
You’ve probably come across data that looks something like this before. It’s usually created by someone who doesn’t know what data should look like and thinks that the data should live in a summarized format because that’s how they want to view it.
In this example, the sales amounts are scattered over 4 different ranges when they should all be in one column with a descriptive column heading like Sales Amount. The year should feature as a piece of data too in its own column. Salesperson and product should also be in their own column.
If this data was in a proper tabular format, it would be easy to summarize it in a similar manner with pivot tables and pivot charts. As is is now, it’s really hard to do anything with it.
This type of data can be a pain to convert to a proper data set. I’ve already shown you how to convert this type of data into a proper data set by using the unpivot feature found in power query.
In this post, I’m going to show you how to combine these tables and unpivot them using the pivot table wizard. Essentially we will use a pivot table to unpivot the data.
PivotTable And PivotChart Wizard
I very briefly touched on the PivotTable And PivotChart Wizard in my 101 pivot table tips post where I mentioned the keyboard shortcut Alt + D + P to open the wizard.
This is a keyboard shortcut from an older version of Excel and unless you know about it, there’s no place to find it in the ribbon.
You can also access this by adding a command to the quick access toolbar for the wizard. It can be found under the Commands Not in the Ribbon section and it’s labeled PivotTable and PivotChart Wizard.
Consolidate and Unpivot Multiple Ranges with the PivotTable Wizard
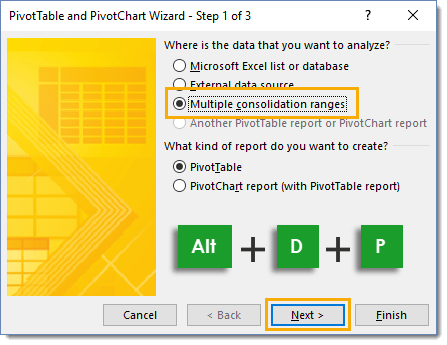
Let’s get started and combine the data. Open the PivotTable and PivotChart Wizard using the Alt + D + P keyboard shortcut, then choose Multiple consolidation ranges then press the Next button.

In the next step of the wizard, choose the Create a single page field for me then press the Next button.

Now select the ranges you want to consolidate.
- Use the select range icon to select a range. We select the whole range including years and products in our example.
- Press the Add button and then repeat step one and two until all the ranges have been added.
- Press the Next button when finished adding all the ranges.

Select the location for your new pivot table, either a new worksheet or somewhere in an existing worksheet. Then press the Finish button. You will now have a blank pivot table.
Build Your Pivot Table

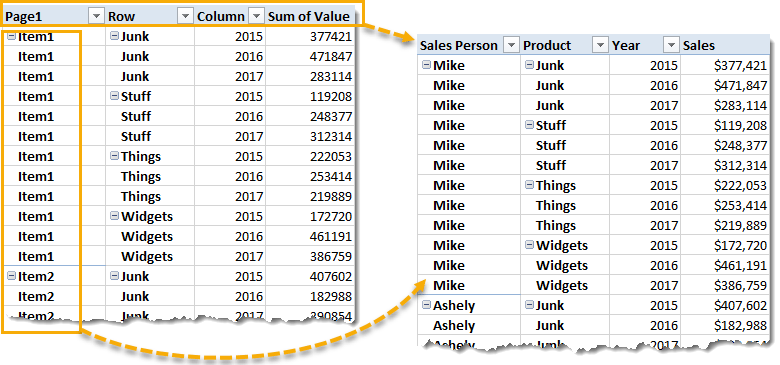
With the new blank pivot table, we need to set it up to build out a new tabular set of data. Move the Page1, Row and Column field into the Rows area of the pivot table. Bring the Value field into the Values area of the pivot table.
Format Your Pivot Table Into a Tabular Data Set
Now we will need to change the format of the pivot table to create our tabular data set. Select the pivot table and go to the Design tab then select the Report Layout command and choose the Show in Tabular Form option from the menu.
We also want to turn off any subtotals the report may have. Go to the Design tab then select the Subtotals command and choose the Do Not Show Subtotals option from the menu.
Next we want to repeat all labels just like we’d have in a normal data set. Go to the Design tab then select the Report Layout command and choose the Repeat All Label Items option from the menu.
Now we just need to change a couple of the column headings by typing over them.
- Page1 – This was our 4 ranges, and in our case represented 4 different sales people. We can rename this Sales Person.
- Row – These were the row headings for our data and in our case it was the product. We can rename this to Product.
- Column – These were the column headings for the numerical values in our data these were the years. We can rename this to Years.
- Value – These were the numerical values in our 4 ranges and in our case they were the sales amounts. We can rename this to Sales.
Now we have a proper data set which has combined all the data from our 4 ranges.
Consolidate Multiple Sheets with the PivotTable Wizard
Even if your data is in a proper unpivoted tabular format, it might be broken up into multiple ranges across different sheets. Maybe your sales data for each salesperson is on a different sheet or each month of data is in its own sheet.
We can use the pivot table wizard to combine the data into one pivot table. It’s the same process, just combining data from different sheets!
Conclusions
Excel has a lot of functionality, and if something seems like a pain and a lot of effort to do manually there is usually a better way.
Power Query can easily consolidate and unpivot data. But not everyone will be using the most recent version of Excel which has power query out of the box or is able to install the add-in because they don’t have the admin rights from IT.
It’s good to know there are older methods, even if they’re a bit hidden.


Hi there
I tried the above with Excel 2016 but not able to get the same result. The issue is excel recognise “Year” as one of the product item, so my “product” column includes “Things”, “Stuff”, “Products”, “Junk” and “Widgets” [Product includes “2015” as one of the item under Sales value”].
Is there anyway that let excel to distinguish “Year”?
Thanks
Make sure you only import this part from the data.
Let me know how you get on.
Hi,
I am trying to do the same, but in addition to the product there is another row header that I want to keep as row: in your example, how do we do if we want to add the countries for instance (assuming there’s not a strict 1:1 relationship between sales person and country).
If I add Country next to Product for each table, Product will show as Row but Country will be in Column, is there a way to change and set it as Row?
Thank you!
The wizard is a somewhat deprecated tool.
You’ll want to start exploring power query for more complicated data wrangling. Here’s a post on unpivoting data with power query.
Dears
I have some basic knowledge in PIVOT TABLE & PIVOT TABLE WIZARD.
i have two excel reports, column labels are same but in different location.
Pivot wizard always taking column 1 as a ROW, how can we change that row field?
Use power query to load the data into a pivot table. Append the two tables with power query and location does matter.
https://www.howtoexcel.org/power-query/the-complete-guide-to-power-query/