
With Power BI, you can connect to a wide variety of data sources, import, transform, model and then visualize data. But you can’t write back to your data source.
It’s a common scenario to try and explain the change in financial results from year to year or quarter to quarter. But if your financials are in a Power BI dashboard, then there is no way to add commentary to explain any change in results.
We can write data back to our source with PowerApps though!
In this post, we’re going to take a look at how we can integrate Power BI and PowerApps.
We’ll take a look at how we can embed a PowerApp into our Power BI dashboards for the purpose of writing comments back to our dataset.
We’ll also look at how we can embed a Power BI tile into our PowerApps.
Building Our Income Statement In Power BI
First let’s look at the set up.
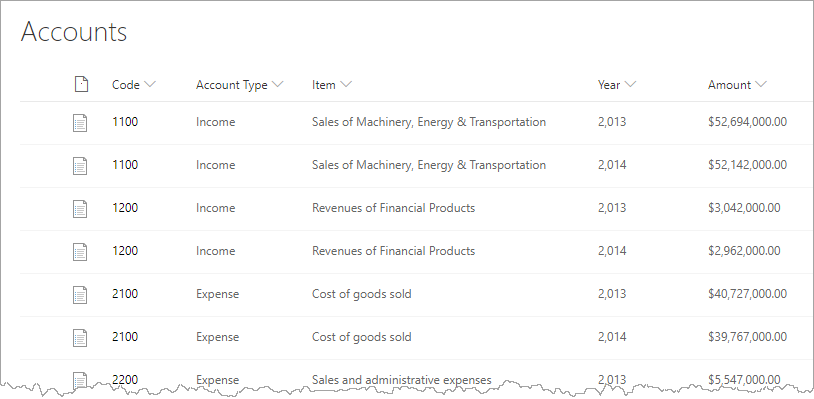
We have a small set of account data which is stored as a SharePoint list named Accounts. This is the data that’s going to be featured in our Power BI dashboard to create an income statement.
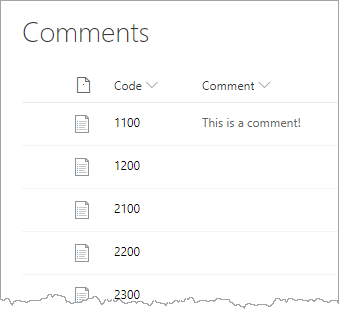
We also have another SharePoint list named Comments. This is a list of unique values from the Code column in our Accounts list along with another column for comments. The sole purpose of this list is to store comments from a user about the income statement in our Power BI dashboard.

We’ve imported both these tables into Power BI and defined a one to many relationship on the Code column in the Comments table (one) to the Code column in the Accounts table (many).
Then we’ve added some DAX formulas to summarize the data into an income statement format within a Matrix visual.
Total Amount =
SUM ( Accounts[Amount] )
First we can define a simple sum on the Amount column of the Accounts table.
Total Expense =
CALCULATE ( [Total Amount], Accounts[Account Type] = "Expense" )
Total Income =
CALCULATE ( [Total Amount], Accounts[Account Type] = "Income" )Next we can create totals for the Income and Expense Account Type.
Operating Profit =
SWITCH (
    TRUE (),
    HASONEVALUE ( Accounts[Account Type] ), [Total Amount],
    [Total Income] - [Total Expense]
)
Then we can define our operating profit calculation as above. This way our Income and Expense subtotals will show normally as the sum of all Income or Expense items respectively, but the grand total will show the difference of these two subtotals.
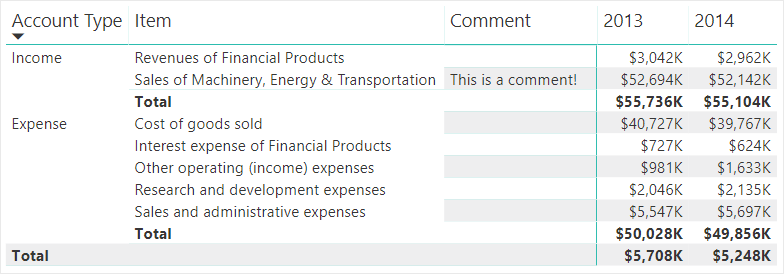
We can then use these measures and data to build a simple income statement in our Power BI dashboard. Above is a Matrix tile in Power BI with:
- Account Type, Item and Comment added into the Rows area.
- Year added into the Columns area.
- Operating Profit added into the Values area.

Then we’ve published this to the Power BI online service.
We can add the PowerApp custom visual in the Power BI desktop version, but we can only use it from the Power BI online service.
Adding The PowerApps Custom Visual
Now we can add our PowerApp custom visual into our Power BI income statement dashboard.

Click on the three ellipses in the Visualization tab and choose Import from marketplace from the menu.
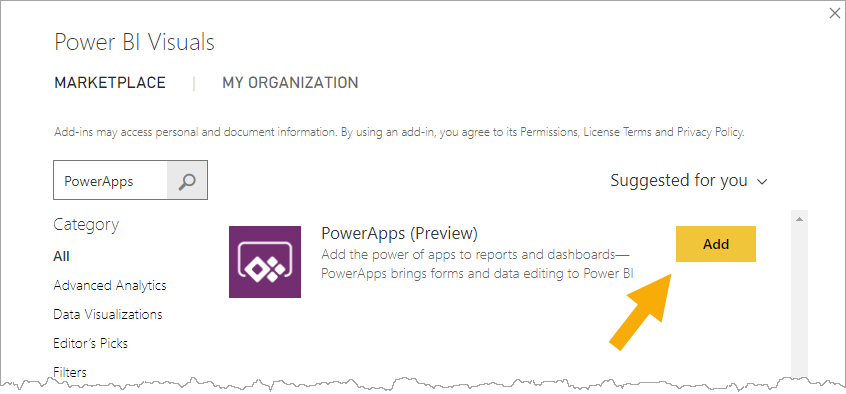
Search for PowerApps in the marketplace and press the Add button to add the custom visual to Power BI.
Now we should see a small PowerApps icon in the set of available visualizations and we can add the visual into our dashboard.
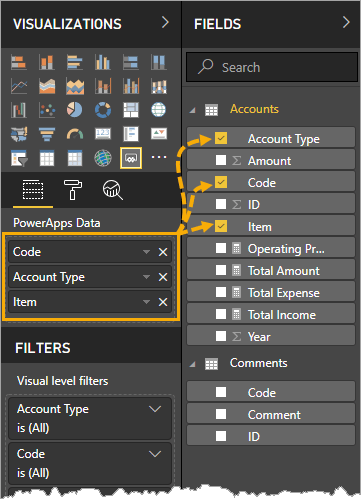
With the PowerApp custom visual tile selected, we can then add data fields which we want to send to our app. We are just going to select the Code, Account Type and Item columns.
![]()
In the PowerApps visual, we can then select our PowerApps environment and choose to connect Power BI to an existing app or create a new app.
We’re going to create a new app. This will create a new app which contains a gallery connected to Power BI with the selected data fields.
Building Our PowerApp
The app we’re going to build is fairly basic and will have two screens.
The first screen is the gallery that’s created for us and is connected to the Power BI data model. We can change the labels so the gallery displays all three fields we had selected in Power BI.
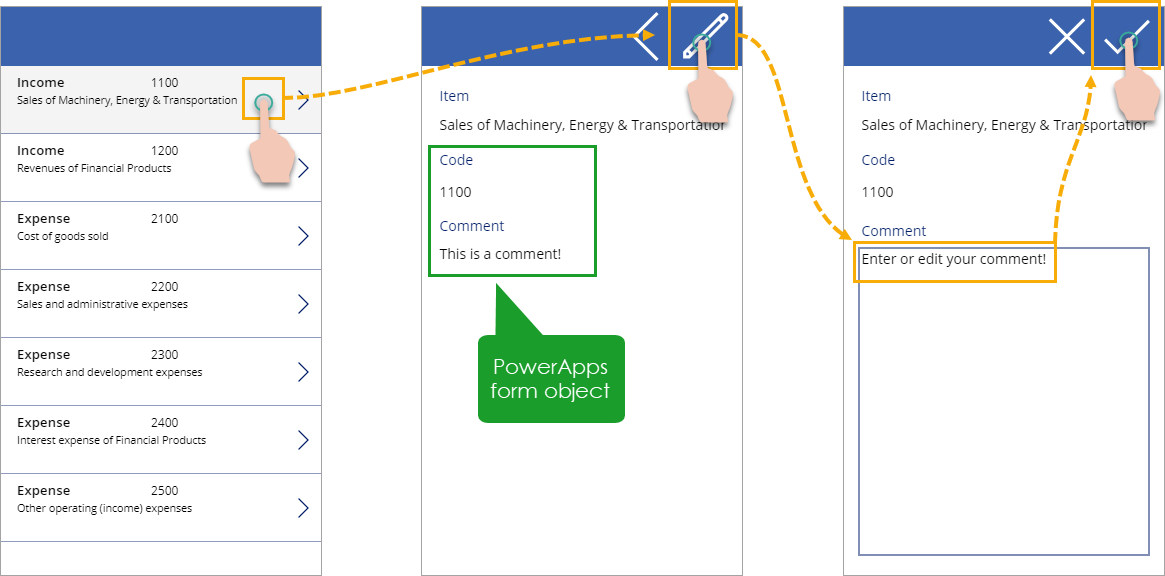
The second screen contains a form object that we connect to the Comments SharePoint list.
Item:
First(
    Filter(
        Comments,
        Code = PowerBI_Gallery.Selected.Code
    )
)
We can use the above formula in the form’s Item property to select the active record of the form. This filters the Comments table based on the Code selected in the gallery to produce a table with one row. Forms expect a record object so we need to use the First function to convert this table of one row to a record.
We can then set up an edit icon to toggle the form between view and edit mode.
We also need a way to write the data back to our SharePoint list, so we can also add a check icon to submit the form.
When done, we can save and publish our PowerApp.
Using The PowerApp In Your Power BI Dashboard
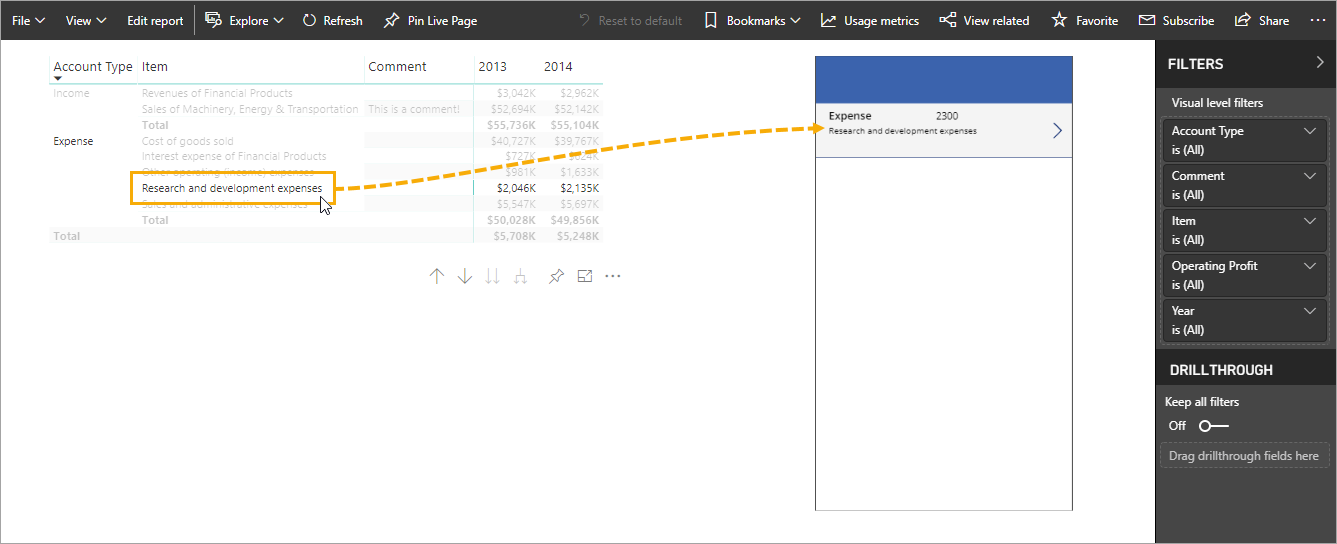
Now we have a PowerApp embedded in our dashboard.
The cool thing is, we can click on items in our martix visual to cross filter our app’s gallery page.
This means we could choose to hide our gallery page entirely and just use the matrix visual to select records in our form. This can be done by moving the second screen above the gallery screen in the PowerApp editor’s object window pane.
Refreshing Power BI
One of the minor drawbacks is the comments entered via the PowerApp will not immediately show up in the Power BI dashboard.
They are immediately written to the SharePoint list, but in order to see them in Power BI, we need to refresh the data model.
Adding A Power BI Tile To Your PowerApp
The other way to integrate Power BI and PowerApps is to add the Power BI tile into a PowerApp. This allows you to see a visual from a Power BI dashboard in your PowerApp.

This is really easy, but we’ll first need to pin our matrix tile into a dashboard in order to use this tile.
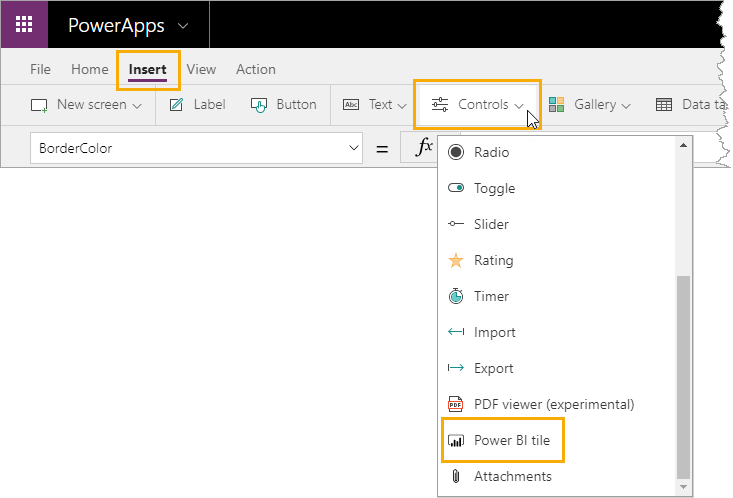
We can add a Power BI tile from the Insert tab ➜ Controls ➜ Power BI tile.
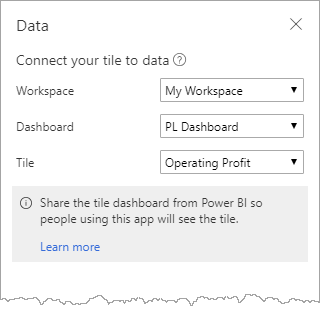
Then we can click on the tile to choose the Power BI Workspace, Dashboard and Tile to connect it to.
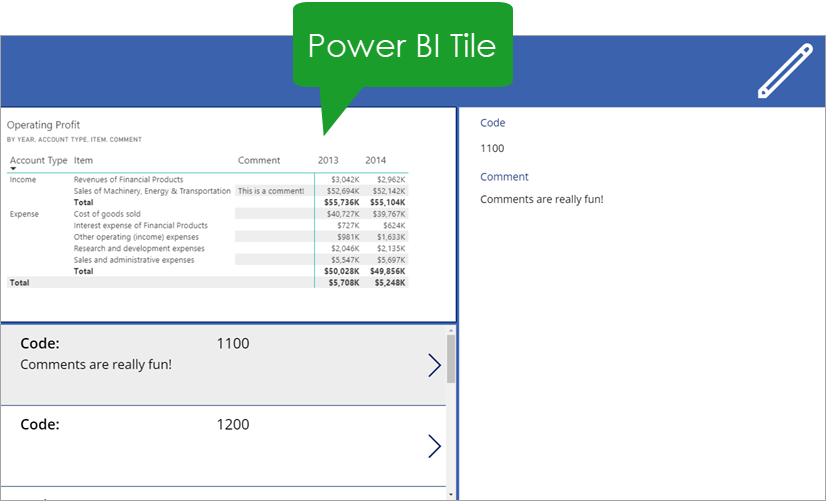
Now we have an exact copy of the visual in our Power BI dashboard embedded in our app. Note, there’s no cross filtering with this tile, it’s static object.
Conclusions
Power BI can read data, but it can’t write data. We can easily embed a PowerApp to write data back to our source data.
In this example, we used PowerApps to write comments back to our data source.
We could use PowerApps for a whole variety different things. Add in some Microsoft Flow and the possibilities are endless!


Hi,
Thank you very much for this post.
I am wondering why in my Power Bi Desktop I can not see the Create App, I just see Choose app.
This is in preview, so they’ve likely changed it a bit since I posted this. Try choose app and you probably be able to create one in the next step.
Hi John,
Thank you, just in Online version we can see Create App.
I am wondering if you are able to share the other functions that you have used in this application.
Especially the measure in DataSource and Submit, I tried to use the Submit Form (Edit Form), but it did not work.
Thanks again.
The DataSource for the form was just the Comments SP list. I have two sets of icons in the upper right and use the visible property to toggle between which are visible.
ChevronLeft icon:
Visible = !EditToggleOnSelect = ResetForm(Form1);Navigate(Screen1,ScreenTransition.Cover)
Edit icon:
Visible = !EditToggleOnSelect = UpdateContext({EditToggle: true})
Cancel icon:
Visible = EditToggleOnSelect = ResetForm(Form1);UpdateContext({EditToggle: !EditToggle})
Check icon:
Visible = EditToggleOnSelect = SubmitForm(Form1);UpdateContext({EditToggle: !EditToggle})
Form1:
DataSource = CommentsDefaulMode = If(EditToggle,FormMode.Edit,FormMode.View)
Item = First(Filter(Comments,Code = PowerBI_Gallery.Selected.Code))
Hope that helps!
This is awesome, I’ll be trying this out this week. If it works, I owe you a beer!