
What Are Pivot Tables?
Pivot tables are one of Excel’s most powerful tools. They allow you to quickly turn thousands of rows of data into meaningful summaries with an easy to use drag and drop interface.
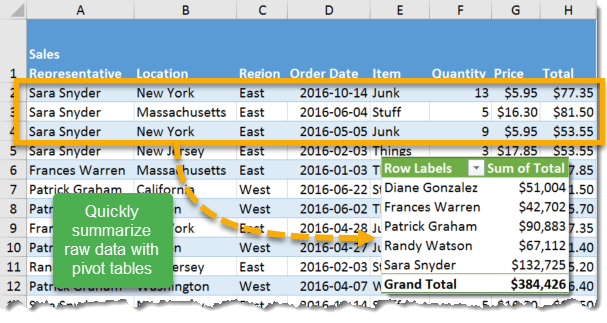
In the example we’re going to go through, we will look at sales data with 5,000 records. Each record or row of data pertains to one sale to one customer and contains the follow information.
- Sales Representative – This is the person who made the sale.
- Location – this is the location of the customer for this sale.
- Region – this is the region the sale was in. In this example the Location field is further grouped into East or West.
- Order Date – This is the date the purchase was made.
- Item – This is the product that was purchased.
- Quantity – This is the number of items purchased in the order.
- Price – This is the price per single unit of the item purchased.
- Total – This is the total price of the order and equals the Quantity x Price.
With this many rows of data it is impossible to look at the data and tell what’s going on without summarizing it. Pivot tables allow you quickly summarize data and answer questions like:
- Which Sales Representative sold the most in 2016?
- What Location had the highest sales in June?
- What was the average total sale amount for each product?
- Who were the top 3 Sales Representatives?
- How much commission did the company payout at 10% of total sales?
- How much tax was paid if the rate of sales tax is 10% in California and 7% in New York?
Pivot tables are dynamic and allow you to “pivot” to different views of your data in a matter of seconds. With pivot tables you can also visualize the summaries by using pivot charts.
Appropriate Data For A Pivot Table
Your data should be in a regular table format to use pivot tables. What does this mean?
- The first row of your data should contain columns headings. These are the labels that describe the data contained in the rows below.
- One row in your data should equal one record. In our example data, one row equals one sale.
- Every column in your data needs a column heading. There should be no blank column headings.
- Your data should not contain any fully blank rows. Some blank fields in a row is ok.
Generally speaking, the data in your table should be one of two broad types.
- Descriptive – These are the items that describe or categorize your data.
- In our example these are the Sales Representative, Location, Region and Order Date. They describe what the values in the same row mean.
- Numerical – These are value based data that can be summarized with sums, averages, minimums, maximums etc.
- In our example these are the Quantity, Price and Total fields.


![6 Ways to Count Colored Cells in Microsoft Excel [Illustrated Guide]](http://cdn-5a6cb102f911c811e474f1cd.closte.com/wp-content/uploads/2021/08/Count-Coloured-Cells-in-Excel.png)

0 Comments