Do you want to count distinct values in a list in Excel?
When performing any data analysis in Excel you will often want to know the number of distinct items in a column. This statistic can give you a useful overview of the data and help you spot errors or inconsistencies.

This post will show you all the ways you can count the number of distinct items in your list. Get your copy of the example workbook in this post to follow along.
Distinct vs Unique
The terms unique and distinct are often incorrectly interchanged liberally. There is a big difference between these terms.
Distinct means values that are different. The distinct values from this list {A, B, B, C} are {A, B, C}. The count in this case will be 3.
Unique means values that only appear once. The unique values from the list {A, B, B, C} are {A, C}. The count in this case will be 2.
💡 Tip: Check out this post if you are actually looking for a count of unique items.
Count Distinct Values with the COUNTIFS Function
The first way to count the unique values in a range is with the COUNTIFS function.
The COUNTIFS function allows you to count values based on one or more criteria.
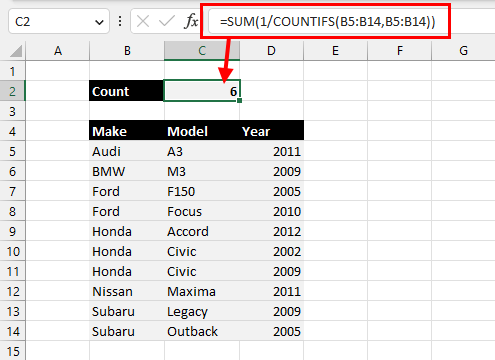
= SUM ( 1 / COUNTIFS ( B5:B14, B5:B14 ) )The above formula will count the number of distinct items from the list of values in the range B5:B14.
The COUNTIFS function is used to see how many times each value appears in the list. When you invert this count you get a fractional value that will add up to 1 for each distinct value in the list.
The SUM function then adds all these fractions up and the total is the number of distinct items in the list.
💡 Tip: If you are working with an older version of Excel that doesn’t support array formulas, then you will need to enter this formula with Ctrl + Shift + Enter.
Count Distinct Values with the UNIQUE Function
Another formula approach to counting the number of distinct items from the list is with dynamic array functions.
However, these are only available in Excel for Microsoft 365.
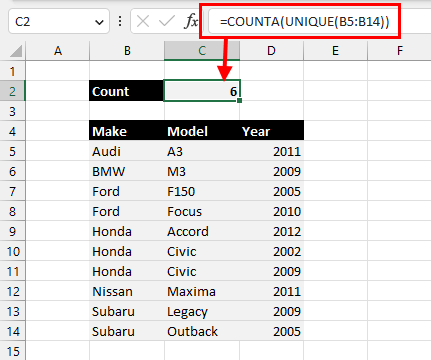
= COUNTA ( UNIQUE ( B5:B14 ) )The above formula will return the count of all distinct items from the list in B5:B14.
The UNIQUE function returns all the distinct values from the list. The number of items in the distinct list is then counted using the COUNTA function.
Count Distinct Values with Advanced Filters
Advanced Filters is a feature that allows you to add complex logic based on multiple fields to filter your lists.
This can also be used to filter the distinct values in your list.
You can then use a SUBTOTAL function to count only the visible items in your filtered list.

Here’s how to count the distinct items with the advanced filters.
= SUBTOTAL ( 103, B5:B14 )- Add the above SUBTOTAL function to the range you want to count values from. The
103argument tells the SUBTOTAL function to only count the visible cells in a range.

- Select the column of data in which you want to count distinct values.

- Go to the Data tab.
- Click on the Advanced command in the Sort and Filter section of the ribbon.

This will open the Advanced Filter menu.
- Select the Filter the list in place option from the Action section.
- The List range should be the range of values previously selected in step 2. You can update this if needed.
- Check the Unique records only option. Even though it says unique, it will actually return the distinct values in the filter.
- Press the OK button.

The list is filtered to hide all the repeated values and the SUBTOTAL will then only count the distinct items in the list.
Count Distinct Values with a Pivot Table
You can get a list of distinct values from a pivot table.
When you summarize your data by rows in a pivot table, the rows area will show only the distinct items. You can then count these with the status bar statistics or the COUNTA function.

You will first need to create a pivot table with the data that you want to get a distinct count.
- Select the data.
- Go to the Insert tab.
- Click on the PivotTable command.

This opens the PivotTable from table or range menu where you can select where you want to place the new pivot table.
- Choose the location for your new pivot table.
- Press the OK button.
This will create a new blank pivot table. When you select any cell inside this pivot table, you will see the PivotTable Fields list appear on the right side of the workbook.

- Drag the field from which you want to count distinct items into the Rows area of the pivot table.

This creates a list of distinct items in the pivot table. Now you can select these items and the count will be displayed in the status bar area.
Count Distinct Values with the Pivot Table Data Model
While using a pivot table will get you the list of distinct items from your data, it’s not ideal for counting the results. There is an additional step of selecting the items and getting the count in the status bar.
But there is a way to use a pivot table and return the count of distinct items inside the Values area of the pivot table.
When you use the pivot table data model feature, it will reveal an extra summary type in the field settings that will count distinct values.

You will insert the pivot table as before, but there is an extra step during the process.
- Check the Add this data to the Data Model option in the PivotTable from table or range menu.

- Drag the field into the Values area. It should default to a count.
- Left-click on the field.
- Select Value Field Settings from the menu options.
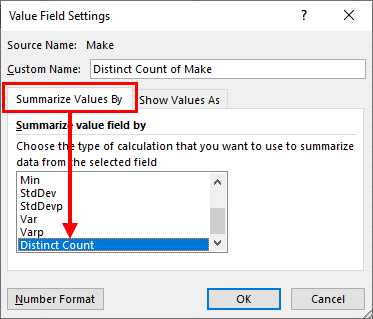
This opens the Value Field Settings menu.
- Go to the Summarize Values By tab.
- Choose the Distinct Count option in the Summarize value field by list. This option only appears when the data has been added to the data model.
- Press the OK button.
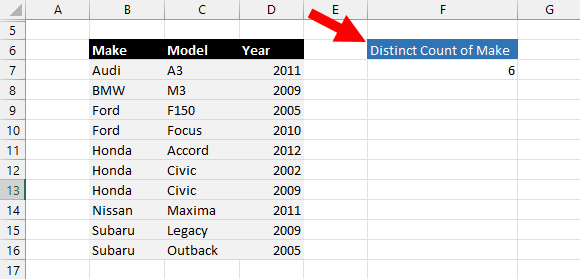
That’s it! The distinct count of items now appears in your pivot table.
This is much more versatile as you can now get the distinct count within another categorical grouping by adding a field into the Rows area.
For example, each value in the pivot table is now a distinct count of the car model based on the make.
Count Distinct Values Remove Duplicates
The Remove Duplicates feature will allow you to get rid of any repeated values in your list.
You can then count the results to get a distinct count of items.

- Select the range of items to count.
- Go to the Data tab.
- Click on the Remove Duplicates command.

This will open the Remove Duplicates menu.
- Select a single column in the list of Columns.
- Press the OK button.

This will remove the duplicates in your list and a popup will show telling you how many items were removed and how many remain. This is the number of distinct items from the list!
📝 Note: This will change the data, so be sure to only perform this command on a copy of your source data so you don’t lose the original.
Count Distinct Values with Power Query Column Distribution
Power Query is a great tool for importing and transforming data.
When building your queries, it will even show you useful summary statistics about the data in the column distribution view. This includes a distinct count.

You will first need to load your data into the Power Query editor to see these features.
- Select the data.
- Go to the Data tab.
- Select the From Table/Range query option.
This will open the Power Query editor and you might already see the column distribution feature with the distinct count.
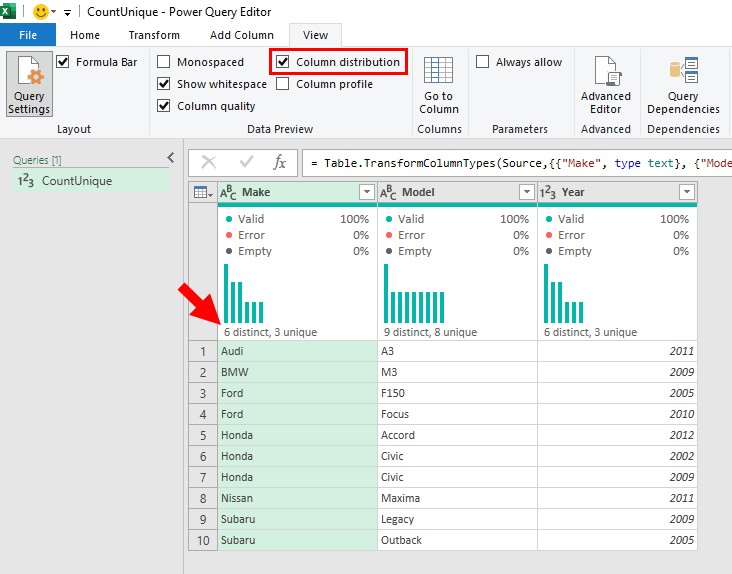
If you don’t see this, you can enable it from the View tab in the editor.
- Go to the View tab.
- Check the Column distribution option in the Data Preview section.
💡 Tip: Hover your mouse cursor over the counts and you’ll see a percentage distribution!
Count Distinct Values with Power Query Transform Tab
The column distribution feature is handy for a quick overview of the data, but you might want to get this value back into Excel from your Power Query.
This is also possible.
- Select the column you want to count.
- Go to the Transform tab.
- Click on the Statistics command in the Number Column section.
- Select the Count Distinct Values option from the menu.
This returns a sing scalar value from your column which is the count of the distinct items in that column.
You can load this back into Excel and it will load into a single column and single row table. Go to the Home tab and click on the Close and Load button.
Count Distinct Values with VBA
There is no prebuilt function in Excel that will count the number of distinct items in a range.
However, you can build your own custom VBA function for this purpose.
Press the Alt + F11 keyboard shortcut to open the visual basic editor. This is where you can place the code for your user-defined function.

Go to the Insert menu and select the Module option to create a new module for your code.
Function COUNTDISTINCTVALUES(rng As Range) As Integer
Application.Volatile
Dim c As Variant
Dim distinctValues As New Collection

On Error Resume Next
For Each c In rng
    If Not (IsEmpty(c)) Then
        distinctValues.Add c, CStr(c)
    End If
Next c
COUNTDISTINCTVALUES = distinctValues.Count
End Function
Copy and paste the above code into the module.
This code will create a new function named COUNTDISTINCTVALUES which can be used anywhere in the workbook just like any other function.
The will loop through each cell in the range it is passed. If the cell is not empty, then the value in the cell is added to a collection object.
Collections will only allow distinct values to be added, so the end result will be a collection of only the distinct values from your range.
The count of the items in the collection is then returned as the function output!

= COUNTDISTINCTVALUES ( B3:B12 )The above formula will then return the distinct count of the values in the range B3:B12.
Count Distinct Values with Office Scripts
Office scripts are another way to get a distinct count for a selected range.
You can create a script that will count distinct items in the active range.

Go to the Automate tab and select the New Script option.
This will open the Code Editor.

function main(workbook: ExcelScript.Workbook) {
    let rng = workbook.getSelectedRange();
    let rngValues = rng.getValues();
    let arrayValues = rngValues.reduce((a, value) => a.concat(value), []);
    let distinctValues = new Set(arrayValues);
    console.log(distinctValues.size);
};
Add the above code and press the Save script button.
This code gets the values from the selected range in the sheet. It will then convert this to a one-dimensional array of values with the reduce function.
This 1D array is then added to a Set. Sets also have the property that they only allow distinct values, so the distinctValues set will only have the distinct values from the selected range.

The number of items is counted with the size and this is returned to the console log to give you the count of distinct values.
Conclusions
There are several options for counting the distinct number of items in a list.
Formulas solutions are great for dynamic live results directly in your sheet. Other features such as advanced filters or remove duplicates are only suited for one-time uses.
If you’re already using Pivot Tables or Power Query in your data processing, then getting the distinct count in those tools is a natural choice.
For any other situation, or as part of a larger automated process, the custom VBA or Office Scripts code solutions might be the best.
Did you know any of these methods? Let me know in the comments!


 👉 Find out more about our Advanced Formulas course!


0 Comments