What is Power Query?
Power Query is a business intelligence tool available in Excel that allows you to import data from many different sources and then clean, transform and reshape your data as needed.
It allows you to set up a query once and then reuse it with a simple refresh. It’s also pretty powerful. Power Query can import and clean millions of rows into the data model for analysis after.
The user interface is intuitive and well laid out so it’s really easy to pick up. It’s an incredibly short learning curve when compared to other Excel tools like formulas or VBA.
The best part about it, is you don’t need to learn or use any code to do any of it. The power query editor records all your transformations step by step and converts them into the M code for you, similar to how the Macro recorder with VBA.
If you want to edit or write your own M code, you certainly can, but you definitely don’t need to.

Get the data used in this post to follow along.
What Can Power Query Do?
Imagine you get a sales report in a text file from your system on a monthly basis that looks like this.
Every month you need to go to the folder where the file is uploaded and open the file and copy the contents into Excel.
You then use the text to column feature to split out the data into new columns.
The system only outputs the sales person’s ID, so you need to add a new column to the data and use a VLOOKUP to get the salesperson associated with each ID. Then you need to summarize the sales by salesperson and calculate the commission to pay out.
You also need to link the product ID to the product category but only the first 4 digits of the product code relate to the product category.
You create another column using the LEFT function to get the first 4 digits of the product code, then use a VLOOKUP on this to get the product category. Now you can summarize the data by category.
Maybe it only takes an hour a month to do, but it’s pretty mindless work that’s not enjoyable and takes away from time you can actually spend analyzing the data and producing meaningful insight.

With Power Query, this can all be automated down to a click of the refresh button on a monthly basis. All you need to do is build the query once and reuse it, saving an hour of work each and every month!
Where is Power Query?
Power Query is available as an add-in to download and install for Excel 2010 and 2013 and will appear as a new tab in the ribbon labelled Power Query. In 2016 it was renamed to Get & Transform and appears in the Data tab without the need to install any add-in.
Importing Your Data with Power Query
Importing your data with Power Query is simple. Excel provides many common data connections that are accessible from the Data tab and can be found from the Get Data command.
- Get data from a single file such as an Excel workbook, Text or CSV file, XML and JSON files. You can also import multiple files from within a given folder.
- Get data from various databases such as SQL Server, Microsoft Access, Analysis Services, SQL Server Analysis Server, Oracle, IBM DB2, MySQL, PostgreSQL, Sybase, Teradata and SAP HANA databases.
- Get data from Microsoft Azure
- Get data from online services like Sharepoint, Microsoft Exchange, Dynamics 365, Facebook and Salesforce.
- Get data from other sources like a table or range inside the current workbook, from the web, a Microsoft Query, Hadoop, OData feed, ODBC and OLEDB.
- We can merge two queries together similar to joining two queries in SQL.
- We can append a query to another query similar to a union of two queries in SQL.
📝 Note: The available data connection options will depend on your version of Excel.
There are a couple of the more common query types available in the top level of the ribbon commands found in the Get & Transform section of the Data tab.
From here we can easily access the From Text/CSV, From Web and From Table/Range queries. These are just duplicated outside of the Get Data command for convenience of use, since you’ll likely be using these more frequently.
Depending on which type of data connection you choose, Excel will guide you through the connection set up and there might be several options to select during the process.
At the end of the setup process, you will come to the data preview window. You can view a preview of the data here to make sure it’s what you’re expecting.
You can then load the data as is by pressing the Load button, or you can proceed to the query editor to apply any data transformation steps by pressing the Edit button.
A Simple Example of Importing Data in an Excel File
Let’s take a look at importing some data from an Excel workbook in action. We’re going to import an Excel file called Office Supply Sales Data.xlsx.
It contains sales data on one sheet called Sales Data and customer data on another sheet called Customer Data. Both sheets of data start in cell A1 and the first row of the data contains column headers.

Go to the Data tab and select the Get Data command in the Get & Transform Data section. Then go to From File and choose From Workbook.
This will open a file picker menu where you can navigate to the file you want to import. Select the file and press the Import button.

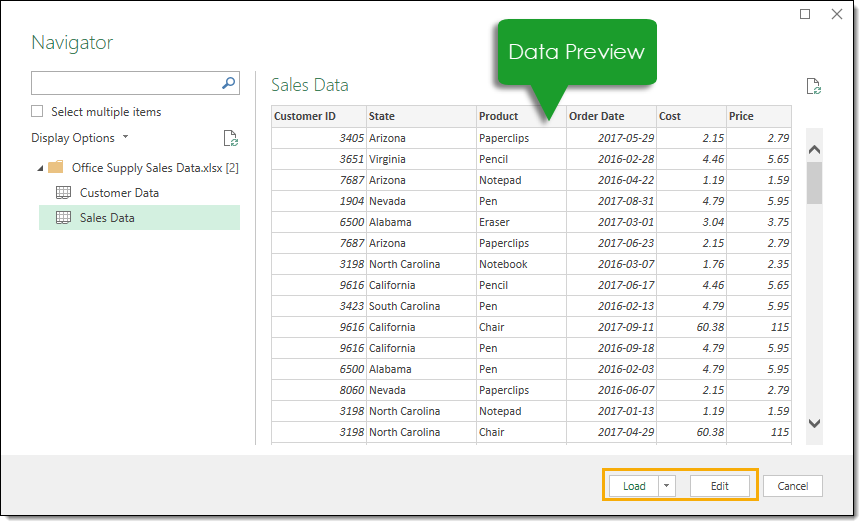
After selecting the file you want to import, the data preview Navigator window will open. This will give you a list of all the objects available to import from the workbook.
Check the box to Select multiple items since we will be importing data from two different sheets. Now we can check both the Customer Data and Sales Data.
When you click on either of the objects in the workbook, you can see a preview of the data for it on the right hand side of the navigator window. This is great for a sense check to make sure you’ve got the correct file.
When you’re satisfied that you’ve got everything you need from the workbook, you can either press the Edit or Load buttons. The edit button will take you to the query editor where you can transform your data before loading it.
Pressing the load button will load the data into tables in new sheets in the workbook.
In this simple example, we will bypass the editor and go straight to loading the data into Excel. Press the small arrow next to the Load button to access the Load To options. This will give you a few more loading options.

We will choose to load the data into a table in a new sheet, but there are several other options. You can also load the data directly into a pivot table or pivot chart, or you can avoid loading the data and just create a connection to the data.

Now the tables are loaded into new sheets in Excel and we also have two queries which can quickly be refreshed if the data in the original workbook is ever updated.
The Query Editor
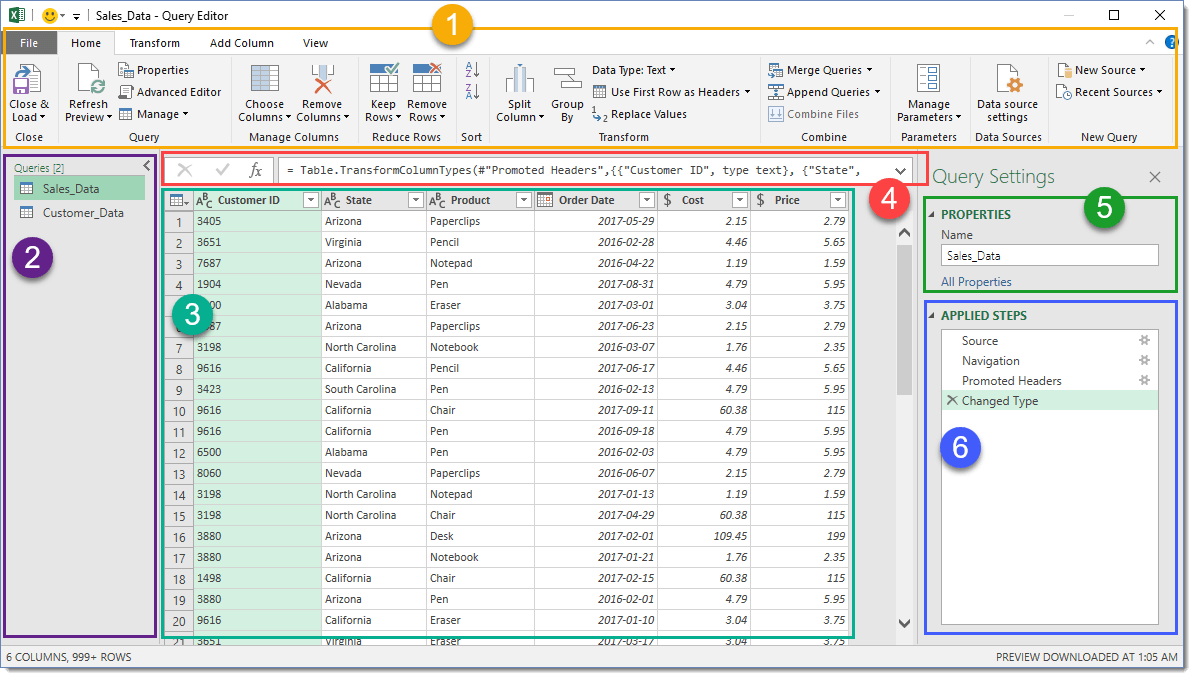
After going through the guide to connecting your data and selecting the Edit option, you will be presented with the query editor. This is where any data transformation steps will be created or edited. There are 6 main area in the editor to become familiar with.
- The Ribbon – The user interface for the editor is quite similar to Excel and uses a visual ribbon style command center. It organizes data transformation commands and other power query options into 5 main tabs.
- Query List – This area lists all the queries in the current workbook. You can navigate to any query from this area to begin editing it.
- Data Preview – This area is where you will see a preview of the data with all the transformation steps currently applied. You can also access a lot of the transformation commands here either from the filter icons in the column headings or with a right click on the column heading.
- Formula Bar – This is where you can see and edit the M code of the current transformation step. Each transformation you make on your data is recorded and appears as a step in the applied steps area.
- Properties – This is where you can name your query. When you close and load the query to an Excel table, power query will create a table with the same name as its source query if the table name isn’t already taken. The query name is also how the M code will reference this query if we need to query it in another query.
- Applied Steps – This area is a chronological list of all the transformation steps that have been applied to the data. You can move through the steps here and view the changes in the data preview area. You can also delete, modify or reorder any steps in the query here.
The Query List
The Query List has other abilities other than just listing out all the current workbook’s queries.

One of the primary functions of the query list is navigation. There’s no need to exit the query editor to switch which query you’re working on. You can left click on any query to switch. The query you’re currently on will be highlighted in a light green colour.
When you do eventually exit the editor with the close and load button, changes in all the queries you edited will be saved.

You can hide the query list to create more room for the data preview. Left click on the small arrow in the upper right corner to toggle the list between hidden and visible.

If you right click on any query in the list, there are a variety of options available.
- Copy and Paste – Copy and paste a query to make another copy of it.
- Delete – Delete the query. If you accidentally delete a query, there’s no undo button, but you can exit the query editor without saving via close and load to restore your query.
- Rename – Rename your query. This is the same as renaming it from the properties section on the left hand side of the editor.
- Duplicate – Make another copy of the query. This is the same as copy and paste but turns the process into one step.
- Move To Group – Place your queries into a folder like structure to keep them organised when the list gets large.
- Move Up and Move Down – Rearrange the order your queries appear in the list or within the folder groups to add to your organisational efforts. This can also be done by dragging and dropping the query to a new location.
- Create Function – Turn your query into a query function. They allow you to pass a parameter to the query and return results based on the parameter passed.
- Convert To Parameter – Allows you to convert parameters to queries or queries to parameters.
- Advanced Editor – Open the advanced editor to edit the M code for the query.
- Properties – Allows you to change the query name, add a description text and enable Fast Data Load option for the query.
If you right click any empty area in the query list, you can create a new query.
The Data Preview
The main job of the data preview area is to apply transformation steps to your data and show a preview of these steps you’re applying.
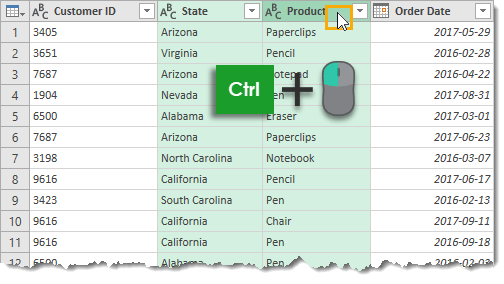
In the data preview area, you can select columns with a few different methods. A column will be highlighted in a light green colour when it’s selected.
- Select a single column with a left click on the column heading.
- Select multiple adjacent columns with a left click on the first column heading, then hold Shift and left click on the last column heading.
- Select multiple non-adjacent columns by holding Ctrl then left click on any column headings you want to select.
You can then apply any relevant data transformation steps on selected columns from the ribbon or certain steps can be accessed with a right click on the column heading. Commands that are not available to your selected column or columns will appear grayed out in the ribbon.

Each column has a data type icon on the left hand of the column heading. You can left click on it to change the data type of the column.
You can choose from decimal numbers, currency, whole numbers, percentages, date and time, dates, times, timezone, duration, text, Boolean, and binary.
Using the Locale option allows you to set the data type format using the convention from different locations. For example, if you wanted to display the date in the American m/d/yyyy format instead of the usual dd/mm/yyyy then you could select United States as the locale.

There’s a small table icon in the top left hand corner of the data preview, you can right click or left click this to access various actions that affect the whole table.

Renaming any column heading is really easy. Double left click on any column heading then type your new name and press Enter when you’re done.

You can change around the order of any of the columns with a left click and drag action. The green border between two columns will become the new location of the dragged column when you release the left click.

Each column also has a filter toggle on right hand side. Left click on this to sort and filter your data. This filter menu is very similar to the filters found in a regular spreadsheet and will work the same way.
The list of items shown is based on a sample of the data so may not contain all available items in the data. You can load more by clicking on the Load more text in blue.
Many transformations found in the ribbon menu are also accessible from the data preview area using a right click on the column heading. Some of the action you select from this right click menu will replace the current column. If you want to create a new column based, use a command from the Add Column tab instead.
The Applied Steps

Any transformation you make to your data will appear as a step in the Applied Steps area. It also allows you to navigate through your query. Left click on any step and the data preview will update to show all transformations up to and including that step.
You can insert new steps into the query at any point by selecting the previous step and then creating the transformation in the data preview. Power Query will then ask if you want to insert this new step. Careful though, as this may break the following steps that refer to something you changed.

You can delete any steps that were applied using the X on the left hand side of the step name in the Applied Steps area. Caution is needed though, as if any of the following steps depend on the step you’re trying delete, you will break your query. This is where Delete Until End from the right click menu can be handy.

A lot of transformation steps available in power query will have various user input parameters and other setting associated with them. If you apply a filter on the product column to show all items not starting with Pen, you might later decide you need to change this filter step to show all items not equal to Pen. You can make these edits from the Applied Step area.
Some of the steps will have a small gear icon on the right hand side. This allows you to edit the inputs and settings of that step.

You can rearrange the order the steps are performed in your query. Just left click on any step and drag it to a new location. A green line between steps will indicate the new location. This is another one you’ll need to be careful with as a lot of steps will depend on previous steps, and changing ordering can create errors because of this.

Right click on any step to access a menu of options.
- Edit Settings – This allows you to edit the settings of the step similar to using the gear icon on the right hand side of the step.
- Rename – This allows you to rename the steps label. Instead of the displaying the generic name like “Filtered Rows“, you could have this display something like “Filtered Product Rows on Pens” so you can easily identify what the step is doing.
- Delete – This deletes the current step similar to the X on the left hand side of the step.
- Delete Until End – This allows you to delete the current step plus all steps up until the end. Since steps can depend on previous steps, deleting all steps after a step is a good way to avoid any errors.
- Insert Step After – This allows you to insert a new step after the current step.
- Move Up and Move Down – This allows you to rearrange the query steps similar to the dragging and dropping method.
- Extract Previous – This can be a really useful option. It allows you to create a new copy of the query up to the selected step.
The Formula Bar
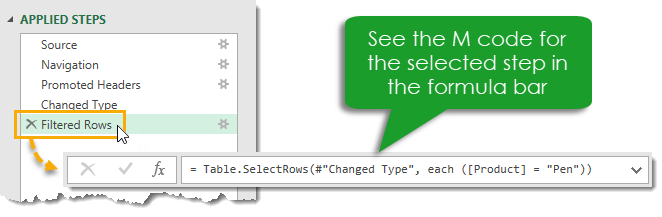
When you click on different steps of the transformation process in the Applied Steps area, the formula bar updates to show the M code that was created for that step. If the M code generated is longer than the formula bar, you can expand the formula bar using the arrow toggle on the right hand side.

You can edit the M code for a step directly from the formula bar without the need to open the advanced editor. In this example, we’ve changed our filter from “Pen” to “Chair” by typing in the formula bar and then pressing Enter or using the check mark on the left to confirm the change. Press Esc or use the X on the
left to discard any changes.
The File Tab
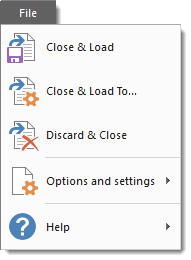
The File tab contains various options for saving any changes made to your queries as well as power query options and settings.
- Close & Load – This will save your queries and load your current query into an Excel table in the workbook.
- Close & Load To – This will open the Import Data menu with various data loading options to choose from.
- Discard & Close – This will discard any changes you made to the queries during your session in the editor and close the editor.
Note, you will still need to save the workbook in the regular way to keep any changes to queries if you close the workbook.
Close & Load and Close & Load To commands are also available from the Home tab.
Data Loading Options
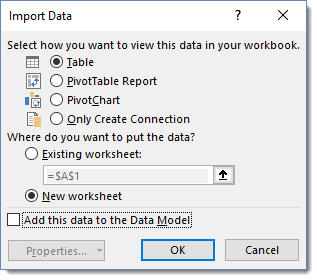
When you use the Close & Load To option to exit the editor, this will open the Import Data menu.
You can choose to load the query to a table, pivot table, pivot chart or only create a connection for the query. The connection only option will mean there is no data output to the workbook, but you can still use this query in other queries. This is a good option if the query is an intermediate step in a data transformation process.
You’ll also be able to select the location to load to in your workbook if you selected either a table, pivot table or pivot chart in the previous section. You can choose a cell in an existing worksheet or load it to a new sheet that Excel will create for you automatically.
The other option you get is the Add this data to the Data Model. This will allow you to use the data output in Power Pivot and use other Data Model functionality like building relationships between tables. The Data Model Excel’s new efficient way of storing and using large amounts of data.
The Queries & Connections Window

When you’re working outside of the power query editor, you can see and interact with all the queries in the workbook through the Queries & Connections window. To open this, go to the Data tab in the regular Excel ribbon, then press the Queries & Connections command button found in the Queries & Connections section.
When opened it will be docked to the right hand side of the workbook. You can undock it by left clicking on the title and dragging it. You can drag it to the left hand side and dock it there or leave it floating. You can also resize the window by left clicking and dragging the edges.
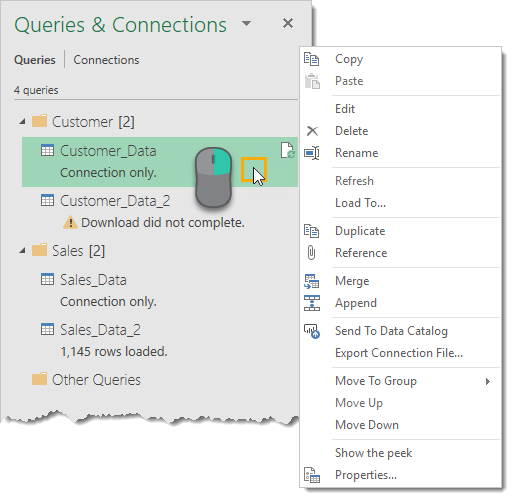
This is very similar to the query list in the editor and you can perform a lot of the same actions with a right click on any query.
One option worth noting that’s not in the query list right click menu, is the Load To option. This will allow you to change the loading option for any query, so you can change any Connection only queries to load to an Excel table in the workbook.

Another thing worth noting is when you hover over a query with the mouse cursor, Excel will generate a Peek Data Preview. This will show you some basic information about the query.
- Data Preview – This is a live preview of the data similar to when first setting up a query.
- Columns – This will give you a list of all the columns contained in the final results of the query along with a count of how many columns there are. Clicking on any of them will highlight the column in the data preview.
- Last Refreshed – This will tell you when the data was last refreshed.
- Load Status – This displays whether the data is loaded to a table, pivot table, pivot chart or is a connection only.
- Data Sources – This will show you the source of the data along with a count of the number of files if you’re it’s a from folder query.
- View in Worksheet – Clicking on this will take you to the output table if the query is loaded to a table, pivot table or pivot chart.
You can also access this Peek view by right clicking on the query and selecting Show the peek.

There are also some useful messages displayed in the Queries & Connections window for each query. It will show you if the query is a connection only, if there were any errors when the query last ran, or how many rows loaded.
The Home Tab
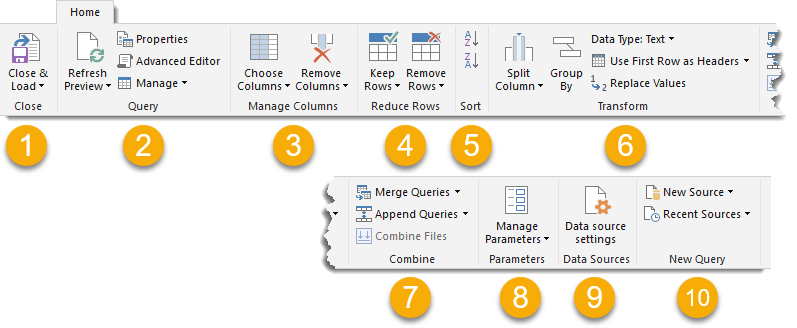
The Home tab contains all the actions, transformations, and settings that will affect the whole table.
- Close – You can access the Close & Load and Close & Load To options from here. These are also available in the File tab menu.
- Query – You can refresh the data preview for the current query or all query connections. You can also open the properties settings and the advanced editor for the current query and there are options under the Manage button to delete, duplicate or reference the current query.
- Manage Columns – You can navigate to specific columns and choose to keep or remove columns.
- Reduce Rows – You can manage the rows of data from this section. There are lots of options to either keep certain rows or remove certain rows. Keep or remove the top N rows, the bottom N rows, a particular range of rows, alternating rows, duplicate rows or rows with errors. One option only available for removing rows is to remove blank rows.
- Sort – You can sort any column in either ascending or descending order.
- Transform – This section contains a mix of useful transformation options.
- Split Columns – This allows you to split the data in a column based on a delimiter or character length.
- Group By – This allows you to group and summarize your data similar to a Group By in SQL.
- Data Type – This allows you to change the data type of any column.
- Use First Row as Headers – This allows you to promote the first row of data to column headings or demote the column headings to a row of data.
- Replace Values – This allows you to find and replace any value from a column.
- Combine – This sections contains all the commands for joining your query to with other queries. You can merge, append queries or combine files when working with a from folder query.
- Parameters – Power Query allows you to create parameters for your queries. For example when setting up a from folder query, you may want the folder path to be a parameter as so you can easily change the location. You can create and manage existing parameters from this section.
- Data Sources – This section contains the data source settings including permissions management for any data sources that require passwords to access.
- New Query – You can create new queries from new data sources or previously used data sources from this section.
The Difference Between the Transform and Add Column Tabs
The bulk of all transformations available in power query can be accessed through either the Transform tab or the Add Column tab.
You might think there is a lot of duplication between these two tabs. For example, both tabs contain a From Text section with a lot of the same commands. It’s not really the case, there is a subtle difference!
When you use a command from the Add Column tab that is found in both tabs, it will create a new column with the transformed data and the original column will stay intact. Whereas using the equivalent command from the Transform tab will change the original column and no new column is created.
This is a critical point to be aware of!
The Transform Tab
The Transform tab sections.
- Table – This section contains commands that will transform the entire table. You can group and aggregate your query, promote rows to headers, demote headers to rows, transpose your data, reverse row order, and count rows.
- Any Column – This section contains commands that will work on any column of data regardless of data type. You can change the data type, automatically detect and change the data type, rename the column heading, find and replace values, fill values down (or up) a column to replace any blanks or nulls with the value above it (or below it), pivot or unpivot columns, move columns to a new location or convert a column to a list.
- Text Column – This section contains commands for text data. You can split columns with a delimiter, format the case, trim and clean, merge two or more columns together, extract text, and parse XML or JSON objects.
- Number Column – This section contains commands for numerical data. You can perform various aggregations like sums and averages, perform standard algebra operations or trigonometry and round numbers up or down.
- Date & Time Column – This section contains commands for date and time data. You can extract information from your dates, times and duration data.
- Structured Column – This section contains commands for working with nested data structures such as when your column contains tables.
The Add Column Tab
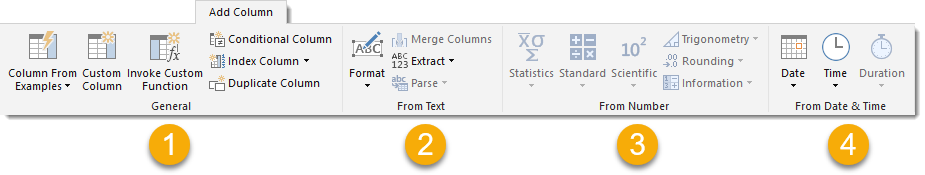
The Add Column tab contains a lot of commands similar to the Transform tab, but the key difference is they will create a new column with the transformation.
- General – This section allows you to add new columns based on formulas or custom functions. You can also add index colummns or duplicate a column from here.
- From Text – Very similar to the From Text section in the Transform tab, but these commands will create a new column with the transformation.
- From Number – Very similar to the From Number section in the Transform tab, but these commands will create a new column with the transformation.
- From Date & Time – Very similar to the From Date & Time section in the Transform tab, but these commands will create a new column with the transformation.
The View Tab
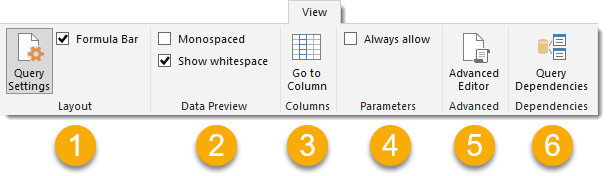
The View tab is quite sparse in comparison to the other tabs. There are no transformation commands to be found in it. Most Power Query users will rarely need to use this area, but there are still a few things worth knowing about.
- Layout – This section allows you to either show or hide the Query Setting pane (which contain the properties and applied steps) and the Formula Bar.
- Data Preview – This section allows you to show or hide whitespace characters or turn the font into a monospace font in the data preview area. This is handy when dealing with data delimited by a certain number of characters.
- Columns – This allows you to go to and select a certain column in the data preview. This command is also available in the Home tab.
- Parameters – This allows you to enable parameterization in data sources and transformation steps.
- Advanced – This will open the advanced query editor which shows the M code for the query. This is also available from the Home tab.
- Dependencies – This will open a diagram view of the query dependencies in the workbook.
In particular, the Query Dependencies view is a useful resource that allows you to see a visual representation of the data transformation process flow.
Conclusions
Power Query can seem overwhelming at first to someone new to it all, but the UI is very well laid out and easy to catch on to. While it might be new to a user, a lot of the concepts should be familiar to an Excel user already.
Getting familiar with all the parts of the editor and the layout of the ribbon tabs is an essential first step in exploring Power Query and incorporating it into your everyday work.
While there is a lot to learn about Power Query, it is worth putting in the time to learn. There is massive potential to save time in repetitive data cleaning and formatting tasks with it. It’s one of the most powerful and useful tools that has been added to Excel since pivot tables.
Want even more power query goodness? Then check out these Amazing Power Query Tips to help you get the most out of it!


 👉 Find out more about our Advanced Formulas course!


Sir, Very well elaborated
Amazing!
I’m working on a BI training document, and this is the perfect foundation. Thank you so much for sharing your expertise!
Also, Table Context Menu is the name of “the small table icon in the top left hand corner of the data preview, you can right click or left click this to access various actions that affect the whole table.”
According to the Guide to Power Query Context Menus cited below, “Context menus are specific to an element, such as a table cell, in the editor pane. A context menu defines actions to take on the selected element or elements.” The following Context Menus are discussed in the link, in addition to other related topics.
Table
Column
Cell
Query Step
Check out this beautiful bean footage:
https://support.office.com/en-us/article/Guide-to-Power-Query-Context-Menus-20BBBAD7-9536-490A-B799-561C6FF5560B#__toc371605432 (There are no beans, there is no footage. I apologize for misleading you.)
Thanks for the tip. Yes, I made up my own names so they might not line up with the official names ?
No problem Thals!
Are we able to download a copy of the sample workbook you use?
Yes, I’ve added a link to the data at the top of the post.
Thank you John, this is absolutely fantastic. You did a phenomenal job with this page.
Thanks Josh, glad you find it useful.
Dear John, Fantastic work! The sample for Customer and Sales data is not available in the link at the top of the post. Would you please upload them so that I can download it
I just tested it and it’s working. Make sure you select the files and then press the download button.
Can you please check the file Office Supply Sales Data.xlsx is missing
Ah, sorry. Didn’t realise I had a missing file in the folder. It’s there now. Try again.
Does the button on the post open a new tab for you? What’s in the tab?
There are two files. Data.txt and Data.xlsx
The sample shown in your post is Office Supply Sales Data.xlsx which is missing
Thanks
Hey John, I work at a bank and have created an Excel template (cheat sheet) full of categories that I want certain data inputted from the FFIEC website (all financial institution financials) and downloaded into my Excel categories I have created. For example, one of my categories is the Balance Sheet with four years worth of history. I’m trying to figure out how to get all of this data, into my template the way I want. These categories are scattered all over different pages of these financials on the FFIEC webstie.
Hi John,
Is the Power Query add-in available for Excel 2010? I have Power Pivot but it looks like its features are limited. My hope is to be able to copy M code for queries I’ve made in Power BI’s Power Query Editor into a workable Excel file and then replicate my DAX measures as well.
Is this doable without upgrading Excel to a newer version?
Thank you.
Power query is available for 2010,but only for the Office 2010 Professional Plus version.
But honestly, getting office 365 is worth it as you get the latest in Excel and other Office apps plus a terabyte of onedrive storage.
Thanks John,
This is a fantastic resource for teaching Power Query.
Well done
I learned so much in this article. Completely amazed. You simplified the Power Query experience to make it easier for us not so advance excel folks can understand. Is there a way to download the article without the ads showing up? 5 Stars!
Hello John. Quick question. What version of Excel you use with your course (Screenshots).
About 8 months ago there was a terrible problem with Excel 2016 loading to the Data Model. It was known by all the Excel big guys.
Was so annoyed that I finally upgraded to O365. All is great now.
I’ll through your tuts in a few weeks so thanks for hard work.
I believe it was Office 365.
Thanks. It appeared that the only way to clear this disaster for sure was to upgrade to 365 and I’m happy I did.
Thanks for getting back to me. I’m eyeing your site for good material on Power BI, Power Query, Power Pivot …. I think I’m a Power Freak!!!
Then you’ll love power automate as well. Check it out.
Can I link a power query to a regular worksheet. When I link to a regular worksheet and refresh the power query the link formula changes, drops down row numbers. I googled this and have not found the answer. Is this possible?
Hello Kim
Before you launch PowerQuery you need to specify the source of the data. Often the data is external but it is often an Excel table “in the same workbook as the query.
So the answer to your question is Yes! The Excel.CurrentWorkbook is a object that Power Query understand totally. As I mentioned, often the date was configured as a table but if it was not then PowerQuery will do that for you.
A slight advantage of this last approach is that the table will be named Table1.
If you do it before then you can name your table Budget or whatever.
Hi,
I have connected MYSQL database from server via IP. Database connected properly and power query working fine and presentng correct data.
Issue : If this excel give to different user and run in different computer. showing driver error. after install driver showing user password dialog box. Mean excel not saved database user and password. please support.
Yes, the user name and password is stored on your computer and not the Excel file.