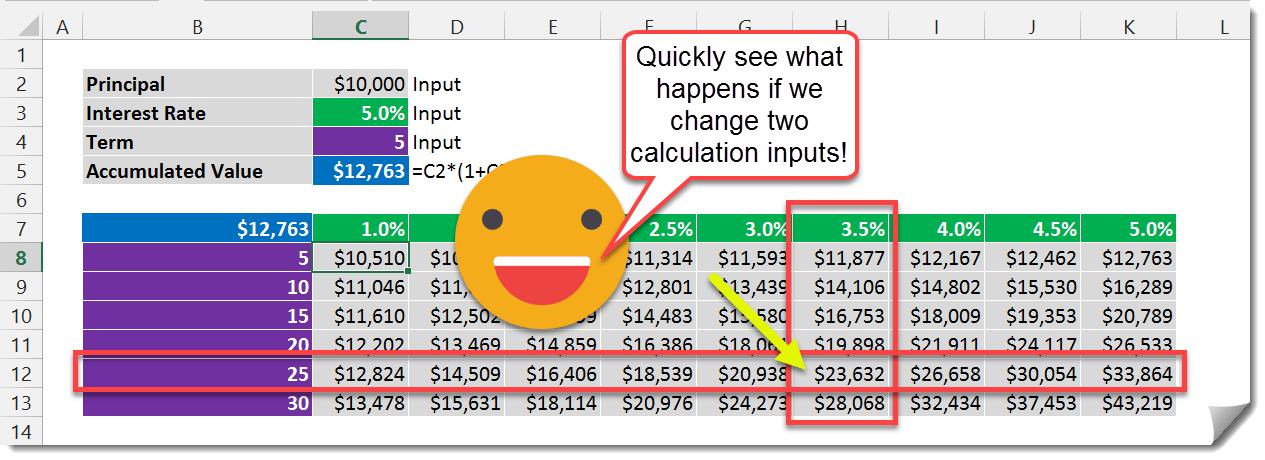
Not to be mistaken with Excel Tables, Data Tables are a tool that can be used to do “what if” type analysis and allows you to see the results of a calculation while varying up to two of the calculation inputs.
In this example we’ll create a data table based on the accumulated value of a bank deposit that earns interest (i.e. how much money will we have after a given time at this interest rate). Our inputs for the calculation are the principal amount, term of deposit and interest rate earned. We’ll use a data table to explore what happens to the accumulated value if the term or interest rate changes.
We have our calculation inputs in C2:C5.
- Principle (C2) – This will be fixed at $10,000 for our example.
- Interest Rate (C3) – This is one of the inputs that will vary in our data table.
- Term (C4) – This is one of the inputs that will vary in our data table.
- Accumulated Value (C5) – This is the calculation our data table will be based on.
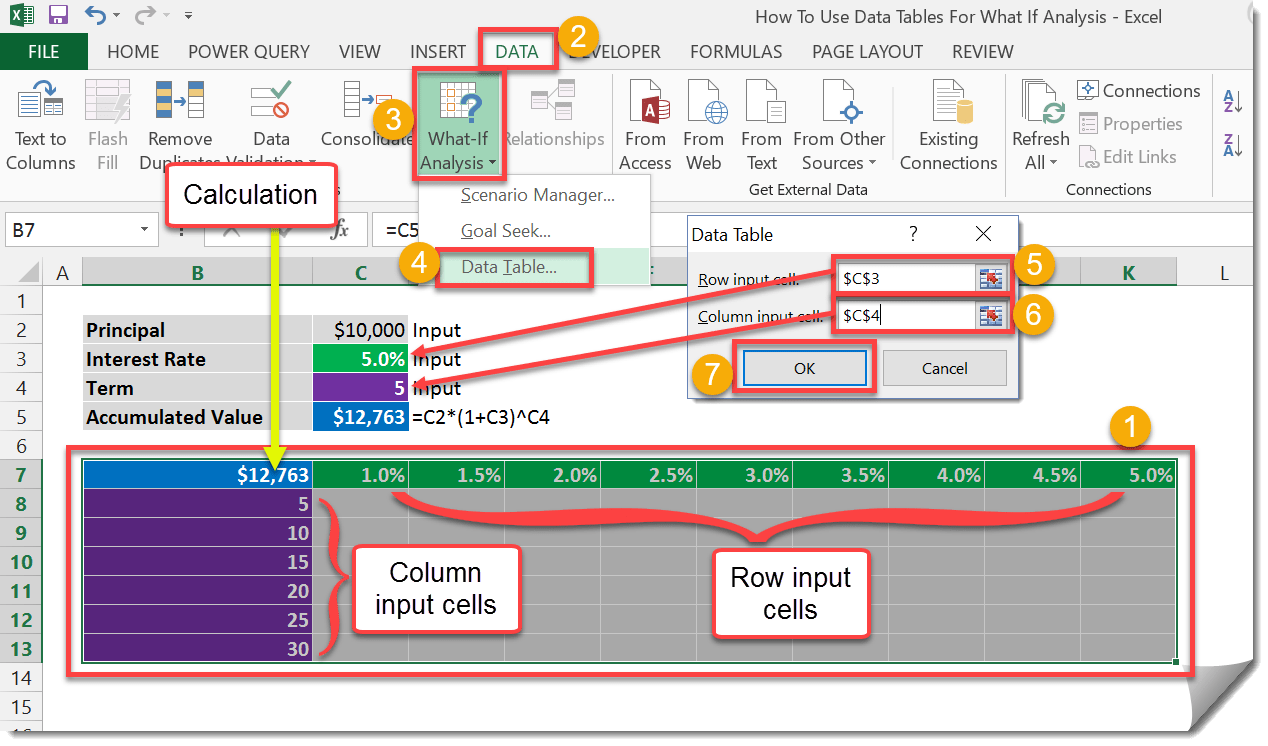
Create the Data Table in the range B7:K13.
- Highlight the range where we want the data table.
- Calculation (B7) – This cell contains a reference to the calculation found in C5 using a formula =C5.
- Column input cells (B8:B13) – This range contains the different term values we want to evaluate our calculation with.
- Row input cells (C7:K7) – This range contains the different interest rate values we want to evaluate our calculation with.
- Go to the Data tab.
- Under the Data Tools section, press the What-If Analysis button.
- Select Data Table from the drop down menu.
- For the Row input cell select the term input (C4).
- For the Column input cell select the interest rate (C3).
- Press the OK button.
You might be asking what’s so special about this and why didn’t we just input this accumulated value formula into cell C8 and copy it across the range C8:K13?
=$C$2*(1+C$7)^$B8
Imagine you work at a credit rating agency and you have super complex calculation to determine the credit rating given to a company. The calculation might be done over many sheets and have many inputs but results in a single value of the credit rating being returned. This complex calculation would not be possible to put into a single cell and copy it across like in our simple example. A Data Table would be the only viable solution to analyse multiple results based on varying inputs in this case.


 👉 Find out more about our Advanced Formulas course!


0 Comments