While learning new functions or exploring new features like pivot tables or charts, it’s always good to have some data handy to use. Here is some random sales data for 2016 to help in your learning.
What’s in the data?
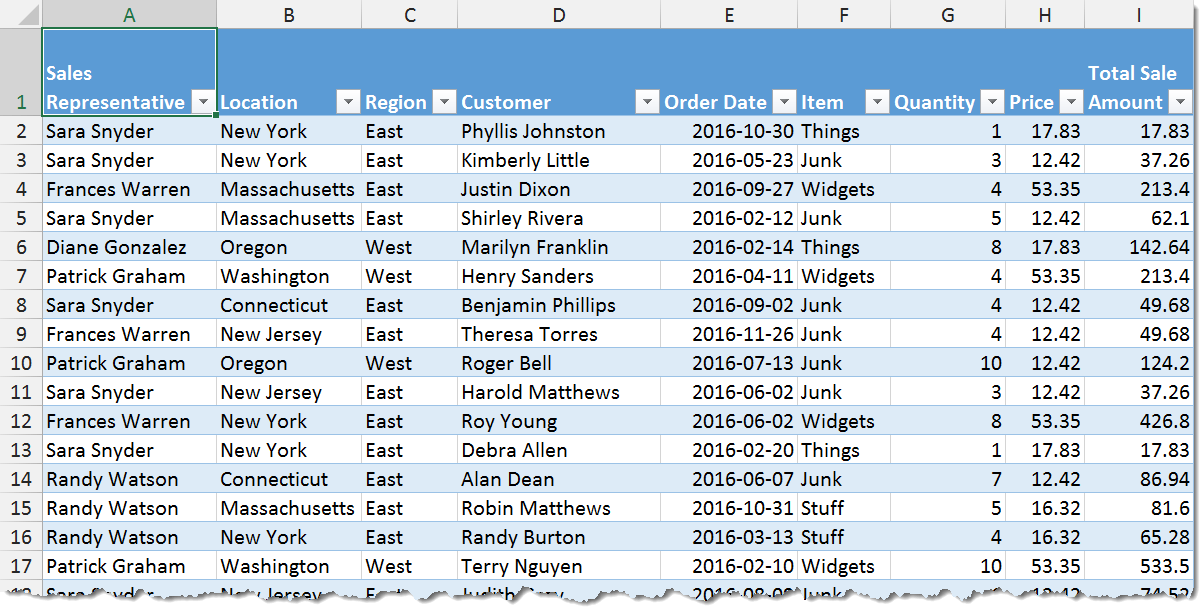
- Sales Representative – 5 different sales representatives including 3 in the East and 2 in the West.
- Location – State the sale occurred in. 8 Different States in the data.
- Region – Region the sale occurred in, either East or West. 4 States in the East and 4 States in the West.
- Customer – Customer’s name on the order. There are 530 different customers in this data.
- Order Date – Date the order was made by the customer.
- Item – Item the customer ordered.
- Quantity – Quantity of the item ordered.
- Price – Price of the ordered item.
- Total Sale Amount – Quantity x Price.
Have fun!


 👉 Find out more about our Advanced Formulas course!


0 Comments