Do you need to calculate the interquartile range (IQR) in Excel? You’re in the right place!
Excel is a powerful tool for data analysis. It allows you to perform various mathematical and statistical analyses. One important statistical analysis you can do on large datasets to extract actionable insight is the interquartile range.
Understanding how to find interquartile range can be an invaluable skill for summarizing and visualizing massive raw data from academics, scientific research, business operations, or marketing activities.
In this blog article, I’ll walk you through the simple steps to compute the IQR using Excel’s functions and tools. Whether you’re a student, a data analyst, or anyone working with data, mastering this skill will help you gain deeper insights into your datasets.
Read this Excel tutorial until the end to explore various processes of finding the interquartile range in Excel!
What Is Interquartile Range?
Data analysts and statisticians use interquartile range measure to assess the spread or dispersion of a data set. It’s particularly useful for analyzing data that may contain outliers or extreme values.
To calculate the IQR, you first need to arrange your data in ascending order. Then, you need to find the median, which is the middle value of the dataset you’re analyzing.
Next, you also need to determine the median of the lower half of the data (the first quartile, Q1) and the median of the upper half (the third quartile, Q3).
The IQR is the difference between Q3 and Q1 and is expressed as the following mathematical equation:
IQR = Q3 - Q1The IQR value of a dataset represents the range within which the middle 50% of the data points fall. It’s a robust measure of dispersion because it’s less influenced by extreme values than the range or standard deviation.
Reasons to Find Interquartile Range in Excel
Find below why you may want to learn the skill of calculating interquartile range in Excel:
- Solving for the interquartile range in Excel helps summarize the spread of your dataset, providing a quick overview of data distribution.
- You can also use IQR analysis to identify potential outliers in your data, which are values significantly different from the rest of the dataset.
- It’s essential for creating box plots in Excel, a graphical representation that displays the median, quartiles, and potential outliers of your data.
- IQR is a fundamental statistic in data analysis, aiding in making informed decisions and drawing meaningful conclusions from your data.
- It allows you to compare the variability or spread of different datasets efficiently.
- Useful quality control processes to determine if a manufacturing process is consistent and within acceptable limits.
- IQR is used in various statistical tests and analyses, including hypothesis testing and ANOVA (Analysis of Variance).
- Unlike the mean and standard deviation, IQR is robust against outliers, making it a preferred choice in some analyses.
- IQR can be incorporated into various visualizations, such as box-and-whisker plots, to enhance data presentation and interpretation in reports or presentations.
Now that you know the basics of IQR, let’s explore various ways to calculate this useful statistical value for any dataset in Excel.
Interquartile Range in Excel Using the QUARTILE Function
QUARTILE function in Excel is the basic formula to calculate IQR. Using this formula, you can calculate the First quartile, Median value, Third quartile, etc. Since IQR equals quartile 1 subtracted from quartile 3, you can get the Q3 and Q1 values using QUARTILE. Then, use the subtraction operator to get the IQR value.

Find below the steps you can follow along:
- Open your Excel workbook where you got a dataset for IQR analysis.
- Select a cell and rename it to Q3.
- Just below this cell, enter the following formula and press Enter:
=QUARTILE(B2:B11,3)
- Similarly, highlight another cell and rename it to Q1.
- Enter the following formula below the above cell and hit Enter:
=QUARTILE(B2:B11,1)So far, you got the Q3 and Q1 values from your dataset. Now, do the following to calculate IQR from the dataset:
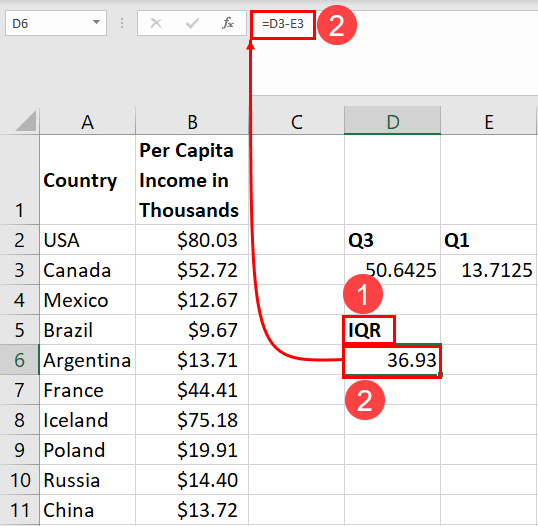
- Highlight a cell and rename it to IQR.
- Below this, enter the following formula:
=D3-E3- Hit Enter to get the IQR value for the selected dataset.
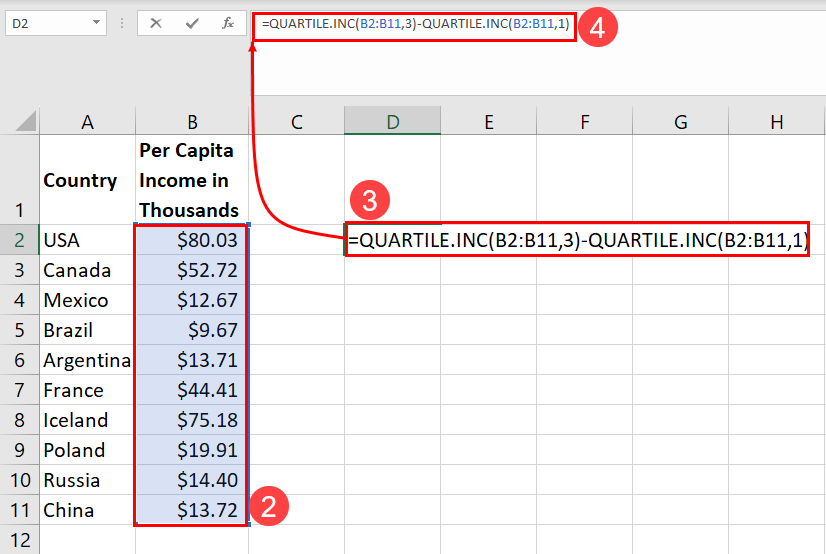
For ease of calculation and to reduce the steps performed to get to the IQR value, you can combine the above formulas into one large formula to solve for IQR in one step. Here’s the combined and modified version of the above formulas:

=QUARTILE(B2:B11,3)-QUARTILE(B2:B11,1)Interquartile Range in Excel Using the QUARTILE.INC Function
You can also use the QUARTILE.INC function in Microsoft Excel to calculate IQR. In particular, QUARTILE.INC calculates quartiles based on the inclusive method, which means it includes the minimum and maximum values of the dataset when determining quartile boundaries.
Find below the instructions to use this function:
- Open your Excel worksheet containing a dataset.
- Suppose, your dataset is in between cell range
B2:B11. - Highlight any cell where you want the IQR value for this dataset.
- Copy and paste the following formula into the cell:
=QUARTILE.INC(B2:B11,3)-QUARTILE.INC(B2:B11,1)
- Hit Enter to get the IQR value instantly.
When using this formula in your worksheet, don’t forget to change the cell ranges according to your own dataset.
Calculate IQR Using MEDIAN
You can solve for the median of your dataset. Then, divide the dataset in two halves above and below the median value. Now, get the median values for these new datasets.
Finally, subtract the small median value from the larger one to get the interquartile range for the main dataset. Here’s how:
- Highlight a cell in your worksheet and put this formula in it:
=MEDIAN(B2:B12)B2:B12is the dataset reference in my worksheet. Yours might be different so watch out for the cell range when using this formula.- Hit Enter to get the median of the main dataset.

- Mark the median value in the dataset by using any background color.
Now, you’ve got a lower and higher half of the data. Do the following:

Select a cell and use the MEDIAN function to derive the median for the lower half of the dataset.

Similarly, get the median value for the higher half of the dataset.
The median of the lower half dataset is Q1 and the median for the higher half dataset is Q3.

Subtract Q1 from Q3 to get the IQR of the larger dataset.
How to Use Excel VBA to Calculate Interquartile Range
Are you comfortable working with a few lines of code in Excel? Do you want to automate the interquartile range calculation in Excel?

Then, this method is particularly important for you. Here, you’ll learn how to automate the whole task of solving for the IQR in Excel using Excel VBA scripting. Follow these steps:
- Go to your worksheet that has the dataset.
- Launch the Excel VBA interface by pressing the Alt + F11 keys.
- Click the Insert button on the Excel VBA toolbar.
- Choose the Module option from the context menu you see.
- Copy and paste the following script into the new module:
Sub CalculateIQRAndDisplay()
    Dim DataRange As Range
    Dim Q1 As Double
    Dim Q3 As Double
    Dim IQR As Double

    ' Define the range of your dataset (B1:B10)
    Set DataRange = ThisWorkbook.Sheets("Sheet2").Range("B1:B10") ' Update sheet name as needed

    ' Calculate Q1 and Q3 using Quartile.INC
    Q1 = WorksheetFunction.Quartile_Inc(DataRange, 1)
    Q3 = WorksheetFunction.Quartile_Inc(DataRange, 3)

    ' Calculate IQR
    IQR = Q3 - Q1

    ' Display the result in a message box
    MsgBox "Q1: " & Q1 & vbCrLf & "Q3: " & Q3 & vbCrLf & "IQR: " & IQR

    ' Place the IQR result in cell C2
    ThisWorkbook.Sheets("Sheet2").Range("C2").Value = IQR ' Update cell reference as needed
End Sub
- Click the Save button on the VBA toolbar.
- Close the Excel VBA Editor interface.
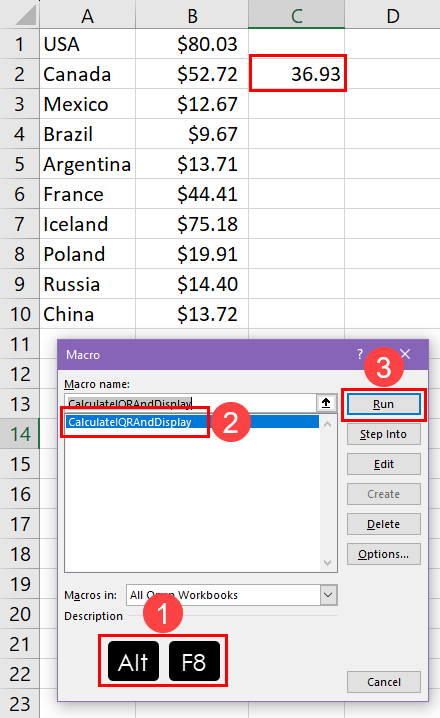
Now, you can run the script by following these steps:
- Press Alt + F8 to bring up the Macro dialog box.
- Select the CalculateIQRAndDisplay macro.
- Hit Run to execute the code.
The above script also contains the instructions to modify it in case your datasets are in different cell references and worksheets than mentioned in this tutorial. So, follow those instructions to modify the script before executing it.
Note: When you make any changes in your Excel workbook using the Excel VBA scripting method, you can’t undo the changes. So, make sure you create a backup copy of your Excel workbook, worksheet, etc., before using the above VBA macro.
Interquartile Range in Excel Using Office Scripts
The VBA-based automation in Excel is only possible in Excel desktop applications. You can’t run VBA scripts on Excel for the web app.
So, if you’d also like to automate the IQR calculation in Excel for the web app, you can use Office Scripts. Office Scripts is also available for Excel for Microsoft 365 desktop applications. This scripting method for Excel is much more advanced and effortless since it uses Typescript as the coding language.

Let’s find below how to use Office Scripts to determine the IQR of a dataset below:
- Click the Automate tab on your Excel desktop or web app.
- Now, click the New Script command inside the Scripting Tools block.
- In the Code Editor that appears, copy and paste the following Office Scripts code:
function main(workbook: ExcelScript.Workbook) {
	let selectedSheet = workbook.getActiveWorksheet();
	// Set range C2 on selectedSheet
	selectedSheet.getRange("C2").setFormulaLocal("=QUARTILE.INC(B2:B11,3)-QUARTILE.INC(B2:B11,1)");
}- Click the Save script button to save it for future use.
- Click the Run button to execute the code.
The above Office Scripts code will use the dataset from the cell range B2:B11 and generate the IQR value in cell C2.
Here’s how you can modify the above script:
- Change the cell range reference
B2:B11to the one you’d like to use in the code element("=QUARTILE.INC(B2:B11,3) - If you want to get the IQR value in a different cell address like D2, put it in place of C2 in the code element
getRange("C2")
Note: Office Scripts feature is only available with Microsoft 365 Business Standard or better subscription plans. Free trials or home subscriptions don’t offer Office Scripts. Also, IT admins of organizations can selectively disable the feature for different users in their network.
So, if you don’t see the Automate tab, check if you’ve got a Business Standard subscription or not. If you’re using Microsoft 365 as an employee of an organization, check with the IT admin to activate the feature.
Conclusions
So far, you learned various ways to find interquartile range in Excel, like the QUARTILE function, the MEDIAN function, Excel VBA, and Office Scripts.
These methods have different use cases. Suppose, you’re working with a limited dataset without automation, you can use the QUARTILE function with ease.
If your dataset is huge and you want automation in your workbook, you can use the Excel VBA or Office Scripts-based methods.
Has the article assisted you in conducting statistical data analysis through IQR values? Are you aware of alternative methods for calculating the interquartile range in Excel that surpass those outlined above? I invite you to leave a comment below to express your appreciation for the article or to offer your valuable feedback.


 👉 Find out more about our Advanced Formulas course!


0 Comments