Suppose you’ve seen a colleague’s or friend’s spreadsheet that dynamically highlights cells based on preset rules or custom formulas. You liked the formatting styles and features so much that you want to implement the same on your own Excel workbooks but you don’t know where to start.
Read this ultimate Excel tutorial to learn how to use conditional formatting in Excel. This is a must-have Excel skill that allows you to create visually appealing and insightful Excel workbooks that attract the attention of recruiters, employers, supervisors, clients, and a wider audience.
What Is Conditional Formatting in Excel?
Conditional formatting in Excel is a feature that lets you change the appearance of cells based on specific conditions or rules you set. It helps you highlight or emphasize data that meets certain criteria, making it easier to spot trends, outliers, or important information in your spreadsheet.

For instance, you’re importing point-of-sale data of all retail stores into your master sales worksheet. Such a dataset is usually large. Here, you want Excel to dynamically highlight sales values above $500.00.
You can apply a conditional formatting rule instead of complex formulas or Find and Replace. Once set for a cell range, it becomes a permanent style. Even if you delete the underlying data, the rule stays.
Benefits of Excel Conditional Formatting
Here’s a list of formatting styles you can impose on a cell or cell range using conditional formatting in Excel:
- Apply colors to cells based on their values, creating a gradient effect to visually represent data trends.
- Highlight the entire row based on a value in a cell of the row.
- Use icons such as arrows, circles, or flags to represent different conditions or rankings within cells.
- Highlight the top or bottom percentage or number of values in a range.
- Format cells based on date criteria, such as highlighting dates that are before or after a certain date.
- Combine multiple conditions using AND/OR logic to create complex formatting rules for in-depth analysis.
- Format cells based on a formula like IF, INDEX, SUM, MOD, etc.
Limitations of Excel Conditional Formatting
Find below the shortcomings of conditional formatting in Excel:
- Conditional formatting doesn’t support data for formulas referenced from an external workbook.
- Its rules cannot directly reference the values of other cells, which might be needed in certain scenarios.
- Conditional formatting may not always appear as expected when printing and certain formatting may not be visible on paper.
How to Access Conditional Formatting in Excel
There are several ways to apply conditional formatting in your dataset. Find below the most common ways:
Using the Quick Analysis Tool
This is the quickest and easiest method to apply conditional formatting to a dataset. However, you can only choose from a preset list of cell formatting if you use the Quick Analysis Tool.

Go to your worksheet and highlight the dataset to which you want to format using a rule. Now, click on the Quick Analysis Tool icon in the bottom-right corner of the selection to open a panel of available conditional formatting.
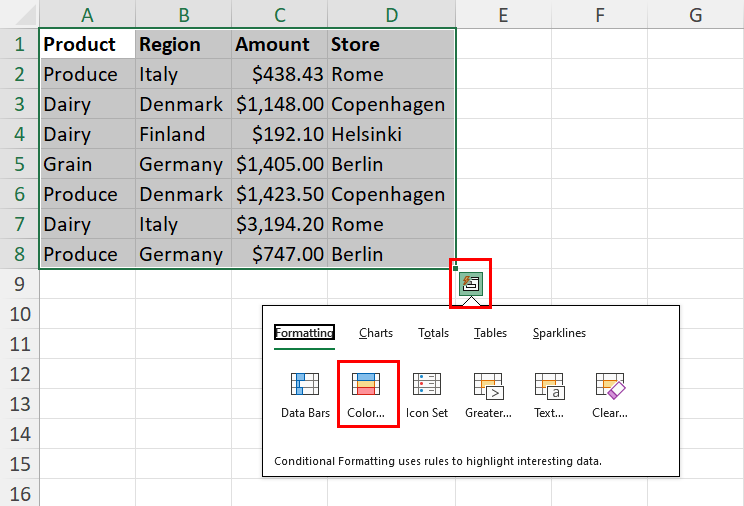
The rules you can apply change automatically depending on the dataset you’ve selected. For example, in the above dataset, I can choose from the following conditional formatting options:
- Data Bars
- Color Scales
- Icon Set
- Greater Than
- Text That Contains

I’ve selected the Color Scales conditional formatting and Excel has automatically applied the rule to the appropriate column that contains numerical values.
Using the Excel Ribbon Menu

To access all the features of the Excel Conditional Formatting tool, you can go to the Home tab. There, locate the Styles commands block and click on the Conditional Formatting drop-down menu.
Here, you’ll find the following features:
- Conditional formatting rules that can be customized:
- Highlight Cells Rules
- Top/Bottom Rules
- Preconfigured rules:
- Data Bars
- Color Scales
- Icon Sets
- Conditional formatting options:
- New Rule
- Clear Rules
- Manage Rules
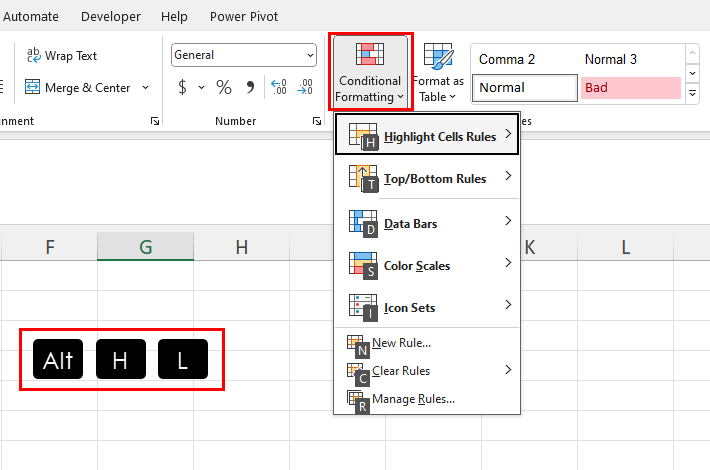
The shortcut key combination to access the Conditional Formatting tool on the Excel ribbon menu is Alt > H > L.
After bringing up the Conditional Formatting menu, you can press the designated key on the keyboard to expand the options to choose from.

For example, after highlighting your dataset, press Alt > H > L > D to apply the Data Bars rule to the selection.
How To Use Conditional Formatting in Excel

Find below a step-by-step guide to use the Excel Conditional Formatting tool to do the following in a sales report shown above:
- Highlight and format cells that contain values less than 20% of total sales.
- Highlight and format all quarterly sales values that are more than 30% of total sales.

Select the cell range B3:E6 and go to Home > Conditional Formatting > Highlight Cells Rules > More Rules.

Doing so will open the New Formatting Rule dialog. There, select the Use a formula… option and enter the following formula into the Format values… field:
=B4<=$F4*0.3
Now click on the Format button to apply the cell formatting you’re looking for. In this example, I’m using red font, parenthesis for values, and yellow shade as cell fill color.

The Preview panel on the New Formatting Rule dialog should show the outcome of the formatting you’ve chosen. If you’re satisfied, click OK to apply the rule.

To apply the same formatting to the rest of the sales data, highlight the cell range B3:E6 and double-click on the Format Painter button in the Home tab.
Highlight the cell range B8:E11 and Excel will automatically apply the formatting there. Now, also select the cell range B13:E17 to apply the above conditional formatting instantly.

To highlight values of more than 30% of total sales, I’d repeat the same steps mentioned above except for the formula to apply conditional formatting, which is as below. Also, I’m using an automatic font color and a green shade as the fill color.
=B3>=$F3*0.3
Finally, the dataset appears as shown above. Here, the audience can easily notice sales that are below 20% of total sales (cells with yellow fill color) and above 30% of total sales (cells with green fill color).
Using Conditional Formatting in Excel in a PivotTable
If you want to enhance the readability of a large PivotTable, you can apply conditional formatting rules to it depending on your data analytics requirements. However, some conditional formatting rules might not be available.

As you can see in the above example, only Greater Than, Less Than, Equal To, and Between rules are applicable. The rest of the conditional formatting is grayed out due to incompatibility.

The method to apply conditional formatting to a PivotTable is also the same as described earlier in this article.
Excel Conditional Formatting Using Preset Rules
You can also use the conditional formatting feature in trend analysis. Here, you can utilize the green, red, and yellow arrow icons to show upward, downward, and flat trends in profits, performance, sales, etc.
The arrow icons fall into the Directional group of Icon Sets preset of Excel Conditional Formatting. Other icons available in this Icon Sets are Shapes, Indicators, and Ratings.
Suppose, you’ve got a dataset with Profit and Trend columns. To easily identify the movement of profits and trends, highlight the dataset, go to Home > Conditional Formatting, and hover the mouse cursor over the Icon Sets option.
Excel will show several options for icon sets. There, click on the 3 Arrows option. Excel will automatically populate trend arrows according to the values of the highlighted cells in the dataset.
Excel Conditional Formatting: Quick Tips
Find below some expert tips that’ll allow you to use conditional formatting in Excel effectively:
Finding Cells Formatted With Conditional Formatting
If you’ve opened a new workbook shared by a colleague, friend, or client, here’s how you can locate those cells formatted using conditional formatting rules.
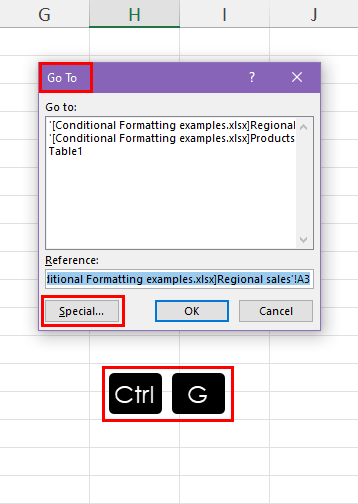
Open the target worksheet and press Ctrl + G to bring up the Go To dialog.

There, click on the Special button to access the Go To Special dialog box.
Under the Select section, click on the category that says Conditional formats. Click OK. Excel will instantly highlight all cells and cell ranges formatted with conditional formatting rules.
Editing Excel Conditional Formatting
Instead of deleting an existing or incorrect formatting rule, you can easily edit it to save time and effort.

To edit a rule that has been applied already, click on the Manage Rules option in Home > Conditional Formatting.

The Conditional Formatting Rules Manager will pop up. There, click on the Current Selection drop-down and choose This Worksheet.

You should see all the rules applied in the worksheet.

Now, double-click on a rule to access the Edit Formatting Rule dialog where you can edit the formatting rules. Don’t forget to click Apply to make the changes effective.
Editing the Order of Evaluation of Rules

If you’ve created more than one conditional formatting rule for the same cell or cell range, Excel will format the cell based on the first rule in the Rules Manager dialog.
So, you can simply move a rule up or down to create the order of priority of the rules.
Clearing Conditional Formatting Rules
Excel’s calculation performance can reduce notably if you use numerous conditional formatting rules in the worksheet. In this situation, you might want to remove some rules to speed up Excel.
To remove a conditional formatting rule, highlight the cell or cell range that contains a rule and click on the Conditional Formatting button on the Home tab.

A context menu will open. Now, hover the cursor over the Clear Rules option and choose Clear Rules from Selected Cells. Contrarily, if you want to get rid of all the conditional formatting rules in the worksheet, click on the Clear Rules from Entire Sheet option.
How to Use Excel VBA to Create a Conditional Formatting Rule
Excel VBA is the go-to tool to automate conditional formatting rule creation in Excel. If you can write an appropriate script, you don’t need to manually set up a formatting rule. No worries if you don’t know Excel VBA or if you’re just learning Excel VBA.
Find below a simple Excel VBA script that formats a cell range based on a value from another cell.

For example, you need to highlight all the sales values in the above dataset in green if they are above $700 and format the rest in yellow.

Use the following script to create two rules for the above task:

Sub FormatCellsBasedonAnotherCell()
    Dim selectedRange As Range
    Dim baseCell As Range
    Dim lessThanColor As Long
    Dim greaterThanColor As Long

    ' Show input box to select the cell range to be formatted
    On Error Resume Next
    Set selectedRange = Application.InputBox("Select the cell range to be formatted", Type:=8)
    On Error GoTo 0

    ' Exit if the user cancels the input box
    If selectedRange Is Nothing Then Exit Sub

    ' Show input box to select the base cell
    On Error Resume Next
    Set baseCell = Application.InputBox("Select the base cell for comparison", Type:=8)
    On Error GoTo 0

    ' Exit if the user cancels the input box
    If baseCell Is Nothing Then Exit Sub

    ' Set the fill colors
    lessThanColor = RGB(255, 255, 153) ' Light yellow
    greaterThanColor = RGB(144, 238, 144) ' Light green

    ' Clear existing conditional formatting
    selectedRange.FormatConditions.Delete

    ' Add conditional formatting rules
    With selectedRange.FormatConditions.Add(Type:=xlCellValue, Operator:=xlLess, Formula1:="=" & baseCell.Address)
        .Interior.Color = lessThanColor
    End With

    With selectedRange.FormatConditions.Add(Type:=xlCellValue, Operator:=xlGreater, Formula1:="=" & baseCell.Address)
        .Interior.Color = greaterThanColor
    End With
End Sub
Don’t know how to create a VBA macro using an Excel VBA script? No Worries! Read the following article to learn how to create a VBA macro:
📒 Read More: How To Use The VBA Code You Find Online
Excel VBA-based conditional formatting rules also show up in the Manage Rules dialog. So, you can edit these rules manually or remove them if needed. I’ve already explained these processes earlier in the Quick Tips section.
Conclusions
You might think the Excel Conditional Formatting tool is a complicated feature but actually, it’s fairly easy if you follow the instructions and tips mentioned in this article.
You shouldn’t face any issues creating and applying rules using the manual method from the Quick Analysis Tool or the Excel ribbon menu.
Try out the Excel VBA method if your worksheet dataset is similar to the example script mentioned in this article. If you’re looking for a different conditional formatting rule like Greater Than, Less Than, Color Scales, Icon Sets, etc., in Excel VBA, you can comment below.


 👉 Find out more about our Advanced Formulas course!


0 Comments