Learn how to create a heat map in Excel with real-world data, easy methods, and effortless steps.
Microsoft Excel offers some of the best data visualization techniques known so far to data scientists, analysts, mathematicians, and statisticians. Among these heat maps are a great tool to visualize data in a 2D plane with color gradients.
When the value increases in certain blocks or sectors of the data, the intensity of certain colors also increases proportionately. Thus, you can easily figure out which block holds the most values.
For example, as a retail store owner, you want to find out which products sell more in specific seasons. With a heat map, you can easily identify the products visually rather than scanning tables containing many rows of data with your eyes.
Join me as I explain the most popular and practical methods to plot Excel heat maps.
Create Excel Heat Map Using Conditional Formatting
The Color Scales cell formatting rules of Excel Conditional Formatting allow you to create heat maps instantly, provided that you select a supported dataset.
Your data must contain values, like revenue, sales, scores, etc., that can be distinguished clearly. Besides whole or fractional number values, you could also have percentages, ratios, and more.

For example, the above dataset is perfect for visualizing how the countries compare with each other across metrics like Oil & Gas, Food Grains, Clothing, Telecom, and more.
If you’ve got such a dataset, go to your worksheet and highlight all the rows and tables containing values.

Click the Conditional Formatting drop-down menu. Now, highlight your cursor over the Color Scales menu and click on any of the color combinations available within 12 sets.
Excel shall automatically generate the heat map on the target dataset according to the values in the cells and columns.
The Color Scales rule applies a weighted average system to each cell comparing the columns. Therefore, the intensity of a shade increases either with the increase or decrease of a particular value.
📒 Read More: How To Make Your Data Visually Appealing
Heat Map Without Numbers

If you wish to hide the values of your heat map, highlight the cell ranges containing the numerical values.
Press Ctrl + 1 to bring up the Format Cells dialog.
Navigate to the Custom number formatting category from the left side navigation panel.
Click the Type field and type this code: ;;;. Click OK to apply the number formatting modification.

Excel shall hide the numbers on the cells of your heat map.
📒 Read More: How to Add Sparklines in Microsoft Excel
Create Excel Heat Map Using a Custom Color Scale
If the built-in Color Scales rules don’t accurately visualize your dataset into a heat map, you can customize the underlying configurations. Thus, your heat map becomes more precise and easily understandable.
By personalizing the Color Scales rules, you can also figure out the color codes used for the lowest, median, and highest points. You can put the color codes in a table as a legend so that, the audience can know how to interpret the intensities of different shades on the heat map.
Let me show you how to create a custom Color Scales rule for your dataset.

Highlight the target dataset and click the Conditional Formatting button. In the context menu, hover the mouse cursor over Highlight Cells Rules and click on the More Rules option at the bottom of the overflow menu.

Excel shall show the New Formatting Rule dialog. Here, click on the Format all cells based on their values selection to bring up the Edit the Rule Description menu at the bottom of the dialog box.
In Edit the Rule Description, you need to customize the following fields according to your input dataset:

- Format Style: Choose between the 2-Color Scale and the 3-Color Scale options. In the 3-Color Scale, you can customize the cell fill color for three points of the whole dataset, namely Minimum, Midpoint, and Maximum. Therefore, the 3-Color Scale option visualizes the dataset better than the 2-Color Scale option.

- Type: Click the Type drop-down menus below Minimum, Midpoint, and Maximum, and choose options like Lowest Value, Percentile, and Highest Value.

- Color: Click on the Color drop-down menus for Minimum, Midpoint, and Maximum to select which shade should denote which value ranges.
Once done configuring the custom Color Scales rule, click the OK button to apply the cell formatting styles to your dataset.

Finally, Excel creates the heat map for you. Create a table to indicate the colors and the value ranges they represent.
📒 Read More: How to Make a Pie Chart in Microsoft Excel
Create Excel Heat Map Using a Contour Chart
Suppose, you’re analyzing a topographic dataset. You’d like to visualize the data in a heat map of 3-dimensional space. In this scenario, you can use the Contour chart from the Surface category of the Change Chart Type tool.

The input dataset shouldn’t contain more than three columns of numerical values since a Controur chart plots data in X, Y, and Z dimensions. Also, the input dataset should have both column headers and row headers. An example dataset is shown above.
You could also include more than three columns. However, in this case, the output Contour chart becomes more complex.

Select the input dataset and click on the Insert tab. Find and click on the Recommended Charts button.

You shall now see the Insert Chat dialog. There, navigate to the All Charts tab.

Click on the Surface category in the left-side navigation panel.

On the right side, click on the Contour option. Click OK to create the chart.

After generating the chart, you can customize it from the Chart Design tab. For example, click on the Switch Row/Column button to swap the data over the axis.

Alternatively, you can click the Select Data button on the Chart Design tab to customize the data range included in the current chart object.
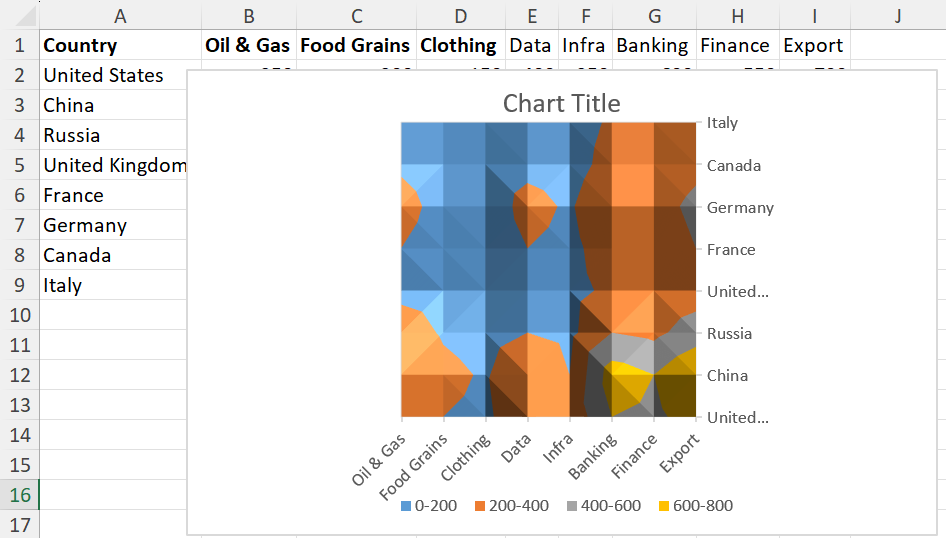
Find above a more expansive Contour chart created from 8 data columns.
Create Excel Heat Map Using Maps
If your input dataset contains geographic data, you can use the Excel Maps chart to create a heat map. Since the data is plotted on a map of the geographies or locations included in the dataset, your audience can easily grasp the underlying message you want to deliver.

An example dataset suitable for the Excel Maps chart is as given above. You can include the names of the states and one of the data columns, like Population (millions) to create a heat map to understand population density by color coding on a 2D map of the United States.
Once you’ve created the heat map for the Population (millions) data column, you can then use other data, like Literacy Rate (%) and GDP (in billions $) for two separate heat maps.
Now, instead of presenting a tabular data comparison of US States by Population (millions), Literacy Rate (%), and GDP (in billions $), you can present the heat maps for better audience attention and comprehension.

Creating a Map chart is pretty straightforward. Select your dataset and click on the Maps drop-down inside the Charts block of the Insert tab.
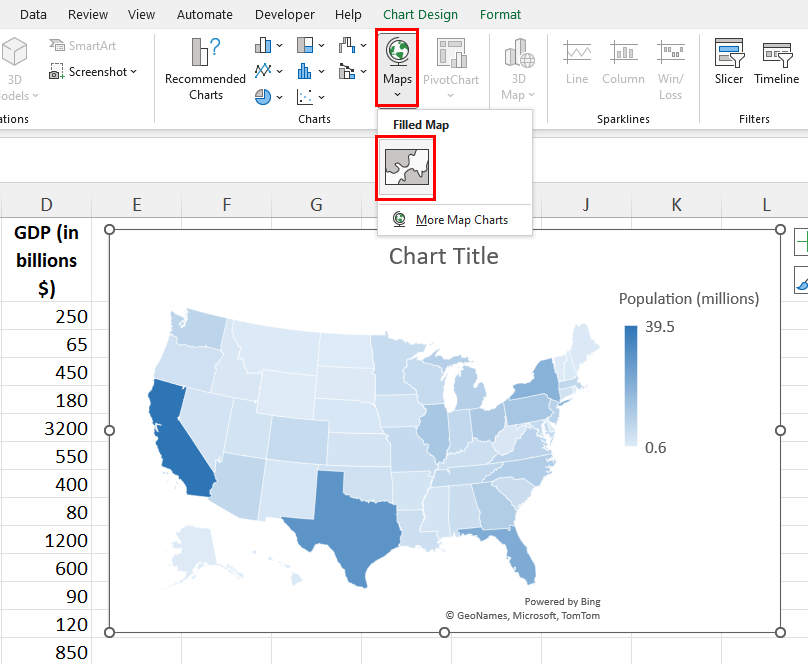
In the Maps drop-down, choose the Filled Map option.
Excel shall automatically choose the map and plot the heat map by analyzing the geographies in the input dataset.
Microsoft Excel uses the Bing Maps API to create the heat map. So, you might get a prompt to allow Excel to share your dataset with Bing Maps.
By default, Excel uses the Sequential (2-color) option to visualize the chart data series. You can change it to Diverging (3-color) to make the heat map more comprehensive. Your audience shall see three levels of data points used to colorize the states on the map, like the lowest value, the middle value, and the highest value.

To modify the Series Options, double-click on the colored map to bring up the Format Data Point navigation panel on the right side of the Excel app.
There, click on the Series Color drop-down and switch to the Diverging (3-color) option.
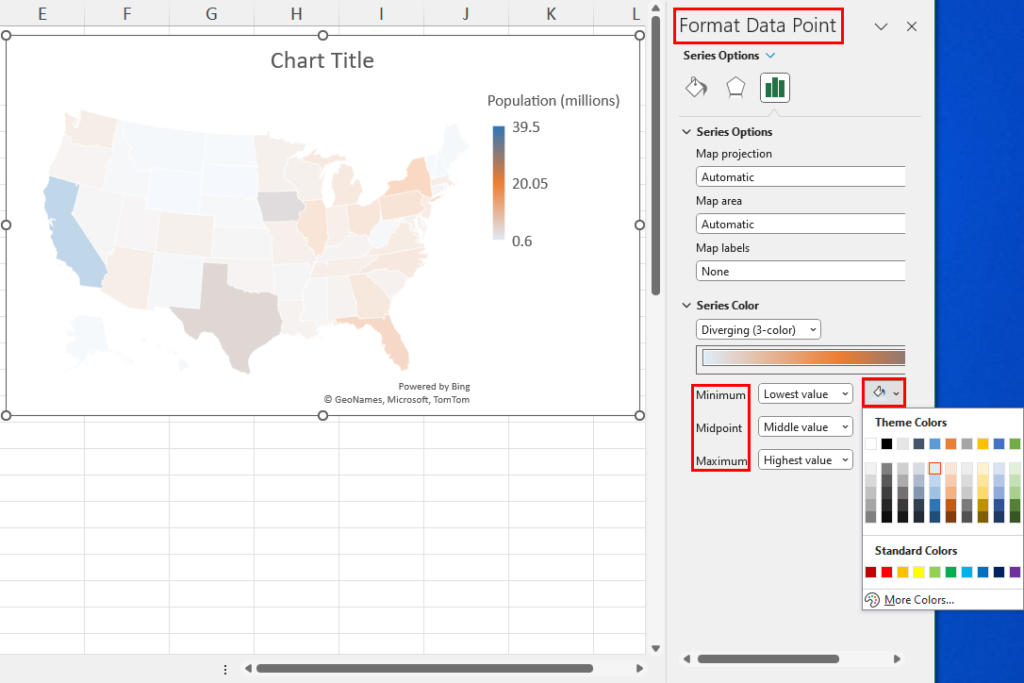
Here, you can customize the color coding for the states by clicking the cell fill color drop-down menus for the Minimum, Midpoint, and Maximum fields.

To plot the next data column, you don’t need to start from scratch. Once you’re done exporting the first chart as an image, click on the map once. This should highlight the input data ranges.

Click on the edge of the Population (millions) dataset and drag it to the next data column. This should plot the data points of the Literacy Rate (%) column on the same map.

To customize this map, bring up the Format Data Series console as explained earlier.
Create Excel Heat Map Using 3D Map
Often you might not find the exact data insight you’re looking for in a 2D heat map. In such a situation, you can use Excel 3D Maps. This feature is only available in Excel 2013 or later editions.

Highlight the input data, preferably geographic data, and click on the 3D Map drop-down in the Tours block of the Insert tab.
Now, click on the Open 3D Maps option from the context menu that opens.

Excel 3D Maps tool shall open. There, you shall see a blank map of the US on a 3D globe.

Click on the Add Layer button to get the Data panel. There, click on the Heat Map tab.

Click on the Add Field button inside the Location field. Choose States from the drop-down menu. Excel captures the names of the states from the input dataset.

Now, click on the Add Field button inside the Value field and choose any one of the column data in your input dataset, like Population (millions). Excel 3D Maps shall create a basic heat map.

To make this heat map better, click the Layer Options drop-down menu and increase the values for the following fields:
- Color Scale
- Radius of Influence

If you wish to change the shading of the heat map, click the Default drop-down menu in the Colors section and choose Custom.
You can change the Low and High colors by clicking on the fill color drop-down boxes. You can also click the Add Color button to add a midpoint for the data points being plotted in the heat map. Now, you can add a third color to the heat map.
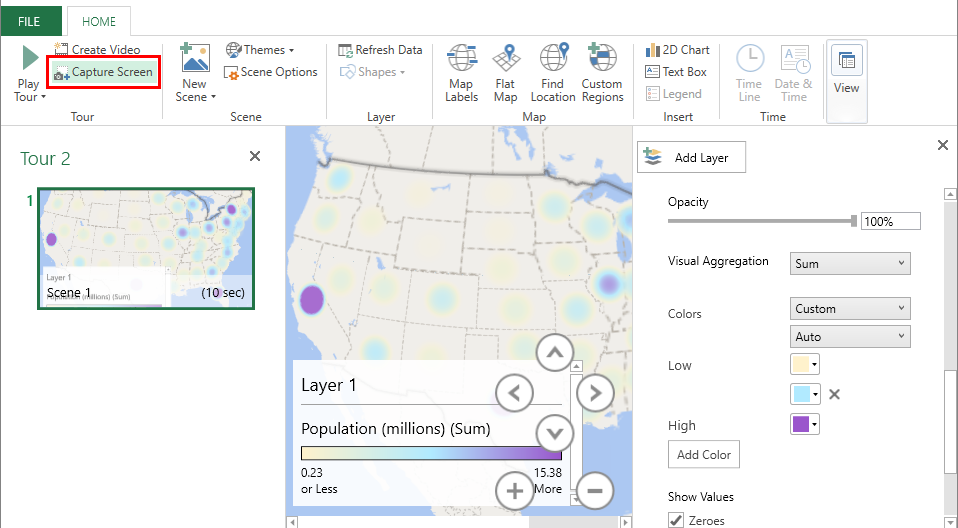
To export the heat map to another app, like Microsoft Word, you can click the Capture Screen button in the Tour block of the Home tab.

Now, go to the destination Word file and press Ctrl + V to paste the copied data as an image.
Create Excel Heat Map Using Excel VBA
If you wish to avoid the manual steps of selecting the data range, finding the heat map tool, and configuring it to a finished visualization, you can use Excel VBA. A VBA macro can help you automate this task.
Find below a simple script you can use:

Sub CreateHeatMap()
    ' Prompt the user to select a range of cells
    Dim rng As Range
    Set rng = Application.InputBox("Select a range", Type:=8)

    ' Prompt the user to choose between 2-color and 3-color heat map
    Dim colorScale As Integer
    colorScale = Application.InputBox("Enter 2 for 2-color heat map, or 3 for 3-color heat map", Type:=1)

    ' Apply the chosen color scale to the selected cells
    With rng.FormatConditions
        .Delete
        Select Case colorScale
            Case 2
                .AddColorScale(2)
                .Item(1).ColorScaleCriteria(1).Type = xlConditionValueLowestValue
                .Item(1).ColorScaleCriteria(1).FormatColor.Color = RGB(255, 255, 255)
                .Item(1).ColorScaleCriteria(2).Type = xlConditionValueHighestValue
                .Item(1).ColorScaleCriteria(2).FormatColor.Color = RGB(255, 0, 0)
            Case 3
                .AddColorScale(3)
                .Item(1).ColorScaleCriteria(1).Type = xlConditionValueLowestValue
                .Item(1).ColorScaleCriteria(1).FormatColor.Color = RGB(255, 255, 255)
                .Item(1).ColorScaleCriteria(2).Type = xlConditionValuePercentile
                .Item(1).ColorScaleCriteria(2).Value = 50
                .Item(1).ColorScaleCriteria(2).FormatColor.Color = RGB(255, 255, 0)
                .Item(1).ColorScaleCriteria(3).Type = xlConditionValueHighestValue
                .Item(1).ColorScaleCriteria(3).FormatColor.Color = RGB(255, 0, 0)
        End Select
    End With
End Sub
To set up a VBA macro using the above script, follow the instructions outlined in this article:
📒 Read More: How To Use The VBA Code You Find Online

If the macro is ready, press Alt + F8 to get to the Macro dialog. Select the CreateHeatMap macro and hit Run.

You must enter the source dataset in the prompt that follows.

Then, you can also choose the color coding system of the heat map.

Finally, Excel reformats the source dataset to a heat map.
Conclusions
So far, you’ve explored six different methods to create a heat map in Excel. If you need to apply this skill occasionally in a small dataset, you can use the Conditional Formatting-based methods.
If your input dataset contains geographical and demographic data, use Excel Maps or Excel 3D Maps-based methods.
Finally, if you wish to create heat maps frequently for a large dataset, use the Excel VBA-based method.
Comment below to let me know which method you liked the most. Also, mention below if you know a better technique to create a heat map in Excel.


 👉 Find out more about our Advanced Formulas course!


0 Comments