Do you want to select a random sample from your Excel data?
A random sample is a selection of records chosen from a larger population in such a way that each record has an equal chance of being chosen.
The goal is to ensure that the sample reflects the population as accurately as possible. If any one group is over-sampled or under-sampled, then it can skew the results and lead to inaccurate conclusions.
Random sampling is essential for statistical work because it helps to eliminate any bias.

This post will show you how to select random samples with and without duplicates. Get your copy of the example workbook used in this post to follow along!
Select a Random Sample with the RAND Function
This method is the most manual but if you only need one sample, then it’s the easiest to set up and use on a one-off basis.
For this, you will need to add a helper column to your data that contains random numbers.
This can be used to sort the data in random order and the top rows can be taken as your random sample.

Here is a list of data for height and weight measurements. Suppose you want to get a random sample of 5 observations from this.
Here is what you need to do.

= RAND ( )- Add a column to the data with the above formula. Copy and paste the formula down the entire column.
The RAND function will generate a random decimal number between 0 and 1 in the column. Now you can sort the data based on this random column. Sorting based on a random number will create a random ordering.

- Select your entire range including the new column of random numbers.
- Go to the Data tab.
- Select the Filter command. This will add a sort and filter toggle to each of the column headings in your dataset. You can use these to sort your data.
💡 Tip: You can also use the Ctrl + Shift + L keyboard shortcut to add the sort and filter toggles to your data.

- Click on the sort and filter toggle in the column of random numbers. This will reveal sorting options for that column
- Select the Sort Smallest to Largest option from the menu.
You can also select the Sort Largest to Smallest option, it doesn’t really matter as either way it will result in a random order for your data.

The data will appear in a random order and you can copy and paste the top 5 rows of your data and take this as your random sampling.
If you need another random sample, just repeat the process.
When you sort the data again, this will cause the RAND function to recalculate and generate new random numbers so you will get a new random order.
Select a Random Sample with Data Analysis Add-in
There is a statistical analysis add-in available to all versions of Excel that has a sampling feature.
You can enable the data analysis toolpak add-in to use this random sampling.
But be aware, this will only allow you to sample data from a single column of numeric data. It also returns duplicate values in the sample and there is no option to sample without repeating values.

Here’s how to use the Data Analysis Toolpak add-in to generate random samples.
- Go to the Data tab.
- Click on the Data Analysis button in the Analysis section of the ribbon. This will only be available when the add-in is installed.

This will open the Data Analysis menu.
- Select the Sampling option from the Analysis Tools.
- Press the Ok button.

This opens the Sampling menu where you can select from a few input and output options.
- Select the Input Range to sample values from. This needs to be a single column of numeric data and you can either include or exclude the column heading label from the selected range.
- Check the Labels option if the Input Range selected included the column heading label, otherwise leave this unchecked.
- Select Random for the Sampling Method.
- Enter the Number of Samples into the input box. This example will return 5 values in the random sample.
- Choose where you want to output the random sample in the Output options section. This example will use the Output Range option and place the results in cell F3.
- Press the OK button.

When you press OK, the sampled values are added to your desired location.
Select a Random Sample using an Array Formula
A very interesting approach to getting a sample is using a dynamic array formula to return a random.
Dynamic arrays allow you to return more than one value from a single formula, so you could use them to return multiple random rows of your data.
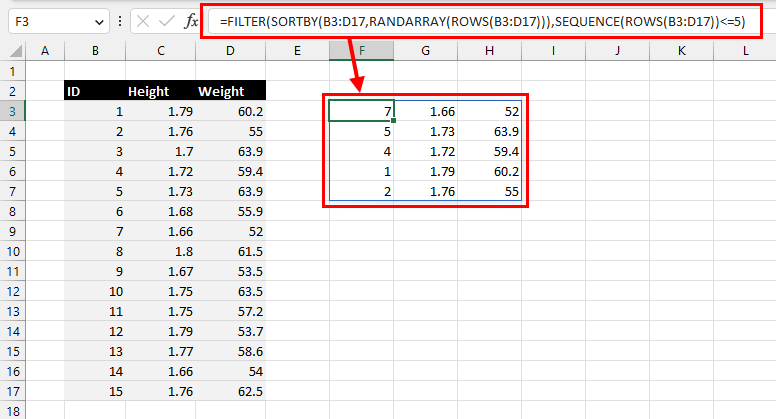
=FILTER(
    SORTBY(
        B3:D17,
        RANDARRAY(ROWS(B3:D17))
    ),
    SEQUENCE(ROWS(B3:D17)) <= 5
)
The above formula will return 5 random rows without duplicates from the range B3:D17.
The ROWS function determines how many rows are in the source data. In this example, range B3:D17 has 15 rows.

The RANDARRAY function then creates a column of random values between 0 and 1 with the same number of rows as the range B3:D17.
The SORTBY function then sorts the data range B3:D17 based on the column generated from the RANDARRAY function. Since this is a column of random values, the SORTBY function will return a randomly sorted range.
The FILTER function is then used on the randomly sorted range to return the top 5 rows as the random sample.

This is achieved by filtering based on the sequence from 1 to the number of rows in the data range.
The filter condition SEQUENCE(ROWS(B3:D17)) <= 5 results in a column where the first 5 values are TRUE. This cause the FILTER function to return the first 5 rows of the randomly sorted range.
This will get you a random sample and you will be able to easily generate new random samples by pressing the F9 key. This will cause the RANDARRAY function to recalculate and new random rows will be returned.
Select a Random Sample using an Array Formula [with Duplicates]
The previous formula method returns a random sample without any repeated rows, but you might want to allow them.
This is also possible with a dynamic array approach.

=INDEX(
    B3:D17,
    RANDARRAY(
        5,
        1,
        1,
        ROWS(B3:D17),
        TRUE
    ),
    SEQUENCE(
        1,
        COLUMNS(B3:D17)
    )
)
The above formula will return a sample with duplicates of 5 rows from the range B3:D17.
The ROWS function is also used here to get the number of rows in the data.

The RANDARRAY function is then used to generate 5 rows of random integer values ranging from 1 to the number of rows in the. This is the list of row numbers that will be included in the random sample.
The RANDARRAY function allows for duplicate values to be returned, so this will result in the random sample potentially having duplicates.
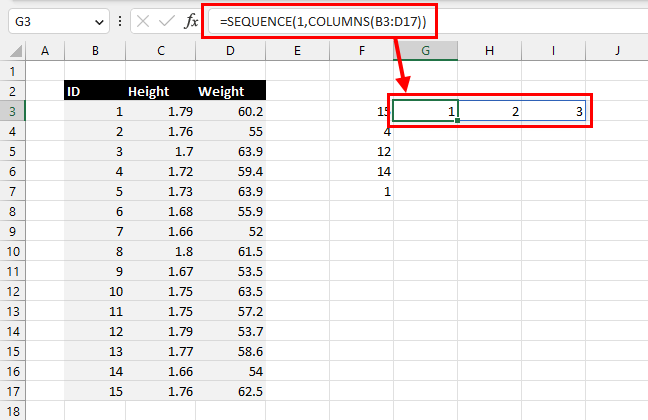
The SEQUENCE function will be used to ensure all the columns of the source data are returned by the INDEX function. This generates an array such as {1,2,3} in this example because there are 3 columns in the source data.
The INDEX function then returns the given set of rows generated with the RANDARRAY function.
This sample can be updated by pressing F9 on your keyboard to recalculate the formula.
Select a Random Sample with Power Query
Power Query is a tool baked into Excel meant for importing and transforming your data into the format you need.
This method will use Power Query to get the random samples from the data with duplicates.

Suppose your data is in an Excel table, then here are the steps to follow.
- Select a cell inside your table.
- Go to the Data tab.
- Select the From Table/Range query command found in the Get and Transform Data section of the ribbon.
This will open the Power Query editor.

- Go to the Add Column tab.
- Select the Custom Column option in the General section.

- Give the new column a name such as Random in the New column name field.
= List.Random(1)- Enter the above M code formula in the Custom column formula input.
- Press the OK button.

This creates a list with one random value in each row.
- Click on the Extract toggle found in the column heading of the Random column.
- Select the Extract Values option.

- Select None from the delimiter list in the Extract values from list popup menu. Since each list only contains one value, a separating delimiter isn’t needed.
- Press the OK button.

This will get a single random value into each row of the column.
- Click on the sort and filter toggle in the Random column.
- Select the Sort Ascending option from the menu.
You can also select the Sort Descending option and the result will be the same. The order of the data will be randomized.

Now you can filter on the top few rows to get the required sample size.
- Go to the Home tab.
- Click on the Keep Rows command.
- Select the Keep Top Rows option from the menu.

- Enter the required sample size in the Keep Top Rows dialog box. This example will use 5.
- Press the OK button.

Now you can clean up the data by removing the Random column. Its job is done.
- Right-click on the Random column heading.
- Select Remove from the options.
You can then load the data back into your Excel workbook. Go to the Home tab and click on the Close and Load command for options to load the data back into a table.

You can then generate another random sample by going to the Data tab and selecting the Refresh option.
Select a Random Sample with Power Query [without Duplicates]
This method will use Power Query to get the random samples from the data without duplicates.
You will need to load the source data from your table into the Power Query editor as before.
Once the data is in the power query editor, you can follow these steps to get the random samples without repeats.

The first thing to do is add an index column that identifies the row number of the source data.
- Go to the Add Column tab.
- Click on the Index Column options menu.
- Select From 1.
This creates a column of whole numbers starting at 1 in the first row of the data. This will be used later to join another query that contains a random selection of row numbers.
Now you will need to create a new blank query to randomly select row numbers for the sample.
- Go to the Home tab of the Power Query editor.
- Click on New Source.
- Choose the Other Sources option.
- Choose Blank Query from the submenu options.
This creates a new one where you can build a random selection of row numbers.
={1..5}- Add the above formula into the formula bar of the blank query and press the Enter key. This will create a sequential list of numbers starting at 1 and going up to 5.
Replace the 5 with whatever number of items you want in your sample. Because the sample is with replacement, this number can be higher than the actual number of rows in the source data.
When you create the list, the power query editor will display a List Tools Transform tab.
- Click on the To Table command found in the List Tools Transform tab.

- Select None for the delimiter in the To Table menu.
- Press the OK button.

- Go to the Add Column tab.
- Select the Custom Column option.

- Give the new column a name such as Random in the New column name input.
Number.RandomBetween(0.5,15.5)- Add the above formula to the Custom column formula input.
- Press the OK button.
This will create a random number between 0.5 and 15.5 for each row. These are going to be rounded to the nearest integer and that will result in whole numbers ranging from 1 to 15. This range is based on the total number of rows in the source data.
The initial range of 0.5 to 15.5 is needed so that each row number has an equal chance of appearing.
- Select the column of random numbers.
- Go to the Transform tab.
- Click on the Rounding option.
- Select Round from the menu.

- Enter 0 for the number of Decimal Places.
- Press the OK button.
Now you have a random selection of row numbers with duplicates.
This can be merged with the original data source.

- Go to the Home tab.
- Select the Merge Queries command.

- Select the Random row number column and the Index column to base the merge on.
- Select the original data source with the added index column.
- Select the Index column.
- Select Left Outer for the Join Kind. This will return all the rows from the random row query and matching rows from the source data.
- Press the OK button.

This creates a column of Tables. Each table should contain a single row corresponding to the value in the Random column.
- Click on the Expand toggle in the Data column.
- Uncheck the Use original column name as prefix option.
- Press the OK button.

You can now clean this query and get rid of the columns you don’t need.
- Hold the Ctrl key and select each column to remove.
- Right-click on the column heading.
- Select Remove Columns from the options.
Now you can load the results to Excel. Go to the Home tab and select Close and Load and load the results to a Table.
You will be able to generate a new sample at any time by going to the Data tab and clicking on the Refresh command.
Conclusions
Random sampling is an important technique in statistics. It’s no doubt you will come across this need if you are doing any statistical analysis with Excel.
Basic helper column techniques and add-ins can be used easily for one-off cases.
But dynamic array formulas or Power Query solutions will be better suited when you require multiple samples from your data.
Did you ever need to randomly select a sample from your data in Excel? How did you get this done? Let me know in the comments below!


 👉 Find out more about our Advanced Formulas course!


Hi John
I have a question Is it even possible to save a web page to excel that has multiple fields all jumbled up to stop you doing it?
It depends on how the page is loaded. You can try Power Query from Web found in the Data tab if it’s a straightforward HTML table, or from Web by example in Power BI if it’s not an HTML table.