If you’re wondering how to find p-values in Excel, you’ve reached the right resource. Keep reading!
Microsoft Excel offers a little over 100 statistical analysis functions. However, you won’t find a function that says p-value. If you’re an expert in statistics and Excel you’ll know that the output of certain statistical formulas are p-values and there’s no need to create a dedicated formula named p-value.
If you’re new to statistics and Excel this article is just for you.
Determining the p-value for different types of hypothesis testing in Excel is a complicated skill. You must choose the Excel functions or tools carefully and verify if the underlying formulas align with the statistical analysis you’re doing.
In this effortless Excel tutorial, I’ll explain all popular Excel functions and tools you can use to calculate p-values in easy steps. I’ll also mention which method is suitable for which experiments of hypothesis. Furthermore, you’ll find here real-world datasets so you can easily relate to the problem at hand.
Moreover, you’ll discover advanced Excel automation techniques that enable you to find p-values more intuitively than all conventional methods.
Let’s dive in!
What Is P-Value?
Think of the p-value (the probability value) like a detective’s clue in a mystery. It tells you if the evidence (data) you have is strong enough to believe a certain idea.
For example, let’s say you have a hypothesis that eating breakfast makes you smarter. You do a study and find a p-value of 0.03. This means there’s only a 3% chance the results are due to luck or random chance.
So, a low p-value suggests your idea might be true, like finding a strong clue in a mystery. But a high p-value, like 0.5, means the evidence isn’t very convincing, like finding a weak clue that might not lead anywhere.
In short, the p-value helps you decide if your findings are worth believing, just like a detective uses clues to solve a case.
Find P-Value Using the T.TEST Function
The T.TEST function in Excel is a statistical function you can use to determine whether two samples are correlated. Whether it’s likely or not likely to have come from the same two underlying populations with the same mean.
It’s also known as the Student’s t-test and the function returns the probability associated (p-value) with the null hypothesis of your study.
The null hypothesis in which the T.TEST function be used could be as outlined below:
“You’re assuming that there’s no significant difference between the means of the two populations from which you’ve drawn the samples.“
Scenarios where you can use this method could be:
- Medical trials to determine if a new drug treatment yields significantly different outcomes compared to a control group.
- To analyze if there’s a significant difference in customer response rates to different advertising strategies in different marketing campaigns.
- To compare the effectiveness of two training methods by analyzing the performance metrics of employees who underwent each.
Whenever you need to test if the null hypothesis mentioned above is true or not for two given lists of values as in Sample 1 and Sample 2, you can use the T.TEST function.
Organize your input dataset as shown in the above screenshot.
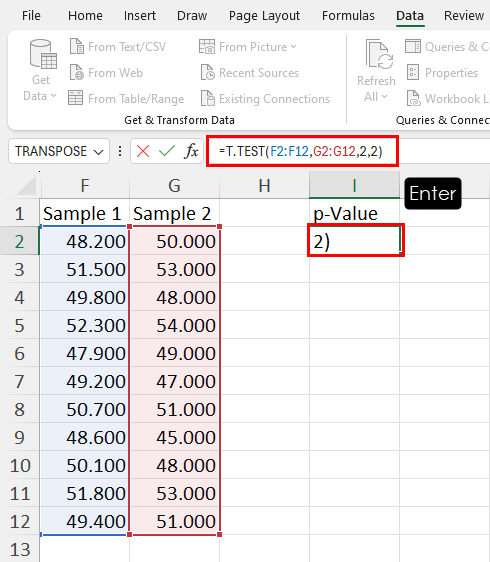
Go to I2 or wherever you want to get the p-value and enter the following formula in it:
=T.TEST(F2:F12,G2:G12,2,2)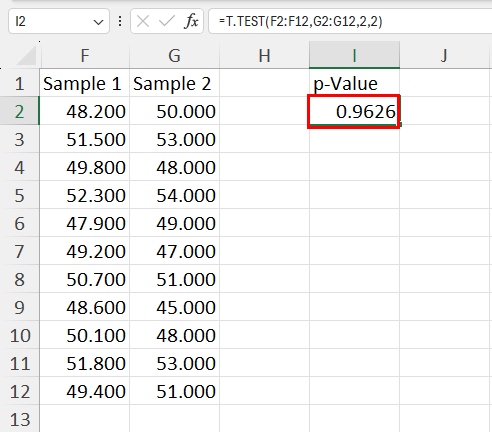
Hit Enter to calculate the p-value.
In the above formula, F2:F12 and G2:G12 are references for Sample 1 and Sample 2. The first numeric value 2 tells Excel that you’re looking for a two-tailed distribution and the second numeric value 2 indicates that you’ve opted for a two-sample equal variance t-Test. So, customize your inputs according to the specific statistical problem you’re solving.
A higher p-value, often more than 0.05 indicates that there’s a solid ground that the null hypothesis is true. The datasets in Sample 1 and Sample 2 are related because I pulled them from two similar populations having a matching average or mean value.
However, it depends on the alpha or the level of significance you’ve chosen when starting the experiment.
Find P-Value Using the Z.TEST Function
You can use Z.TEST to calculate the p-value which is the one-tailed probability value of the following null hypothesis:
“There’s no significant difference between the sample mean and the population mean.“
In this case, you know the mean and standard deviation of the population.
Find below some common statistical experiments where you can use the Z.TEST function:
- Analyzing the performance of students on a standardized test and determining if their average score differs significantly from the national average.
- Testing the effectiveness of a new drug treatment by comparing the average recovery time of patients to a known population average.
- Assessing whether the average wait times in two different customer service queues are statistically different from each other.
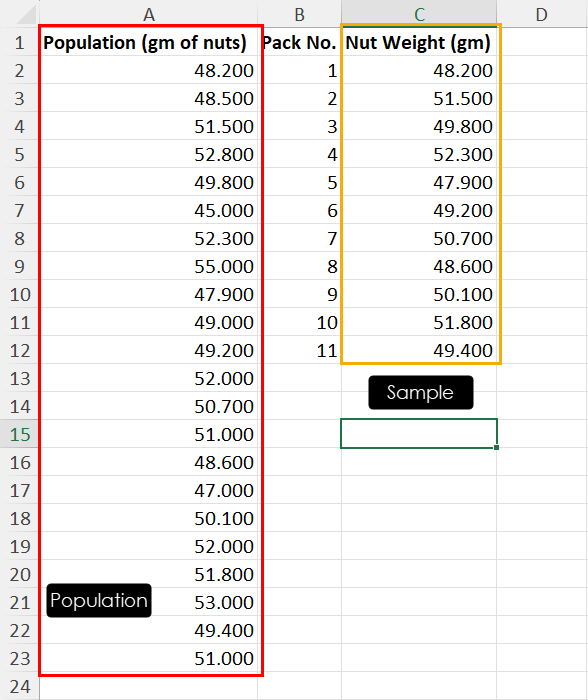
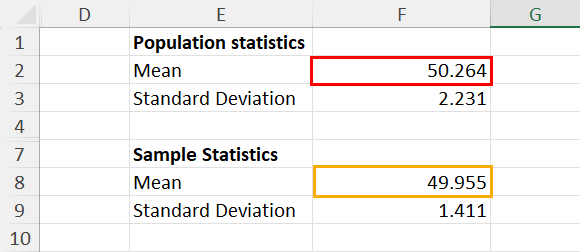
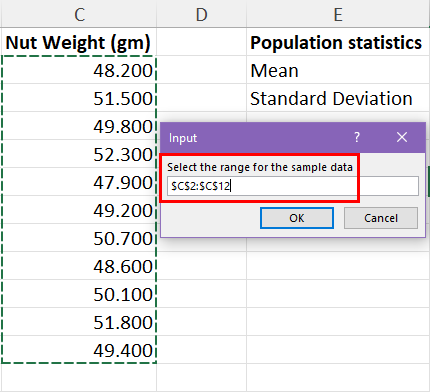
In the above dataset, I’ve drawn 11 samples from a population of 22 chocolate nutty bars. I aim to prove that the mean weight of the nuts in the population isn’t significantly different from the mean weight of nuts in the drawn sample.
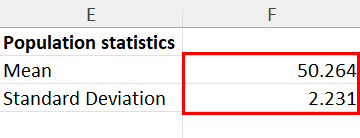
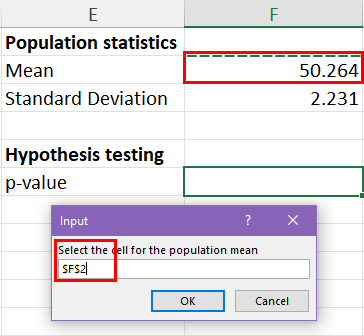
I’ve also calculated the required basic statistics for the population data as shown above.
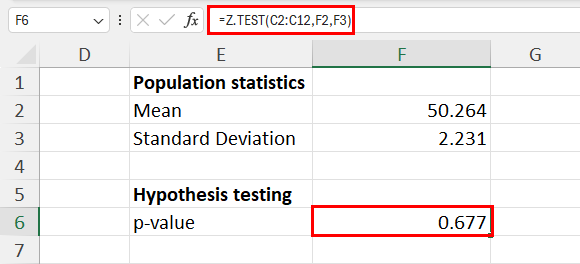
Now, I can easily find the p-value for this experiment in F6 by entering this formula:
=Z.TEST(C2:C12,F2,F3)In the above formula, you simply need to enter the cell range for the sample dataset (C2:C12), the mean of the population (F2), and the standard deviation of the population (F3).
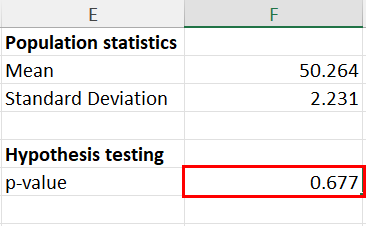
The p-value of this Z-test experiment is 0.677 which suggests that the null hypothesis is true.
The mean of the population and sample datasets aren’t significantly different.
Find P-Value Using the F.TEST Function
The F.TEST function helps prove whether the following null hypothesis value is true or not by generating a p-value as the output:
“That the variances of the two populations are equal.“
If the p-value is below the significance level value or the alpha of the experiment, suppose, 0.05, then the null hypothesis isn’t true, and vice versa.
So, when you’re comparing the variance of two samples drawn potentially from different populations you use F.TEST to calculate the p-value and not any other methods explained so far.
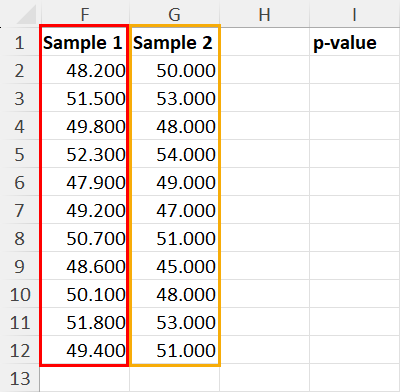
Using this method is too easy. Just arrange the input datasets of two different samples as shown above.
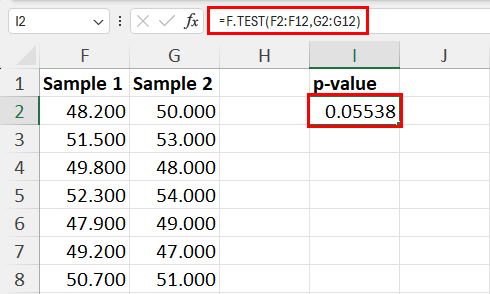
Now, use the following formula in the cell where you’d like to generate the p-value of the F-test:
=F.TEST(F2:F12,G2:G12)You only need to enter the references of the two sample datasets in any order.
The p-value of the example dataset is 0.553 which is more than the alpha (0.05) set for the experiment. Hence, the null hypothesis is valid.
Find P-Value Using Data Analysis ToolPak
The Data Analysis ToolPak add-in allows you to find the p-value using a graphical user interface. Also, there are additional inputs you can use to refine the results. However, you must possess some previous experience in statistical data analysis to use the add-in effectively.
Using Regression
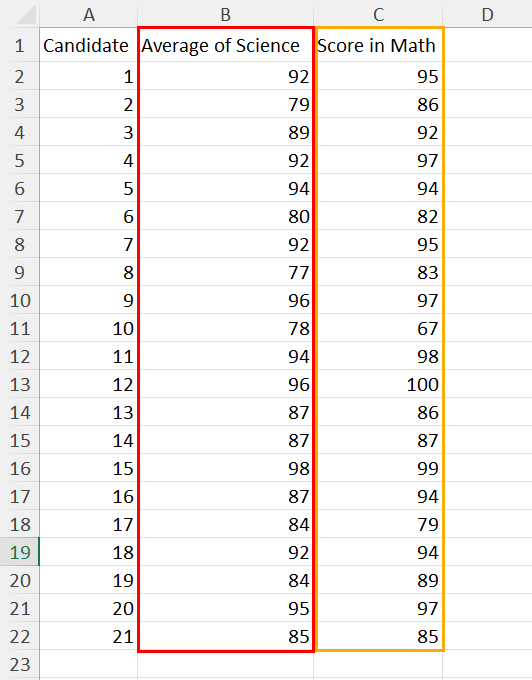
Suppose, you’ve got a dataset as shown above. Here, you’re studying if there’s any correlation between the average grades of the science subjects and that of the individual math grades.
In this problem, your null hypothesis should be as outlined below:
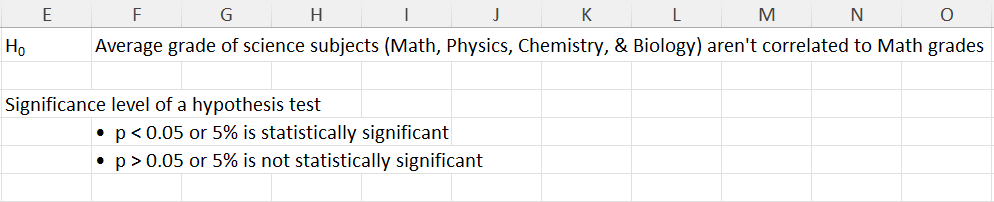
“Average grades of science subjects (Math, Physics, Chemistry, & Biology) aren’t correlated to Math grades.“
You’ve aimed for an alpha or significance level 0.05 as the cut-off to determine if the null hypothesis stands or not.
Now, follow this simple Excel tutorial to activate the Data Analysis ToolPak add-in in your Excel desktop app:
📒 Read More: How to Install Data Analysis Toolpak in Microsoft Excel
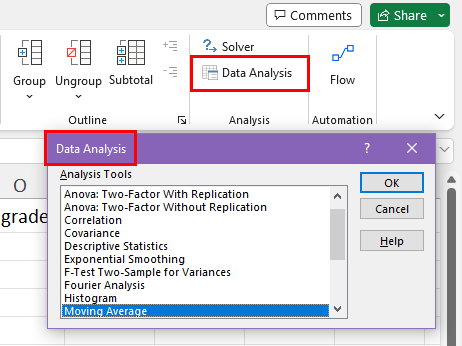
If you’ve already done it, go to the Data tab and click on the Data Analysis command inside the Analysis block.
You shall see the Data Analysis dialog box.
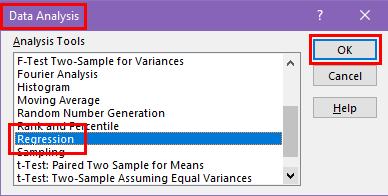
Scroll down the scroll bar to find the Regression tool, select it, and click the OK button.
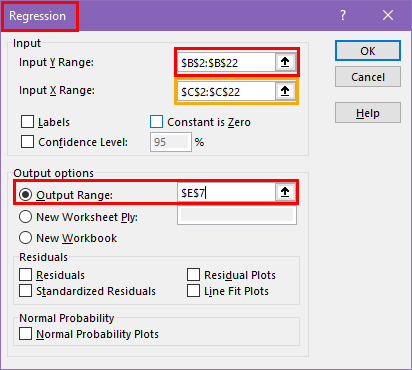
You should now see the Regression analysis configuration dialog.
Choose the dependent variable or the outcome variable that you are trying to predict or explain in the Input Y Range field. In the current exercise, it’s the Average of Science column.
Select the independent variables or predictors that are believed to influence the dependent variable in the Input X Range field. In the present example, it’s the Score in Math.
Click on the Output Range option and select a blank cell on the active worksheet. From this cell, Excel shall start printing the result of the Regression analysis.
Click OK to start the analysis.
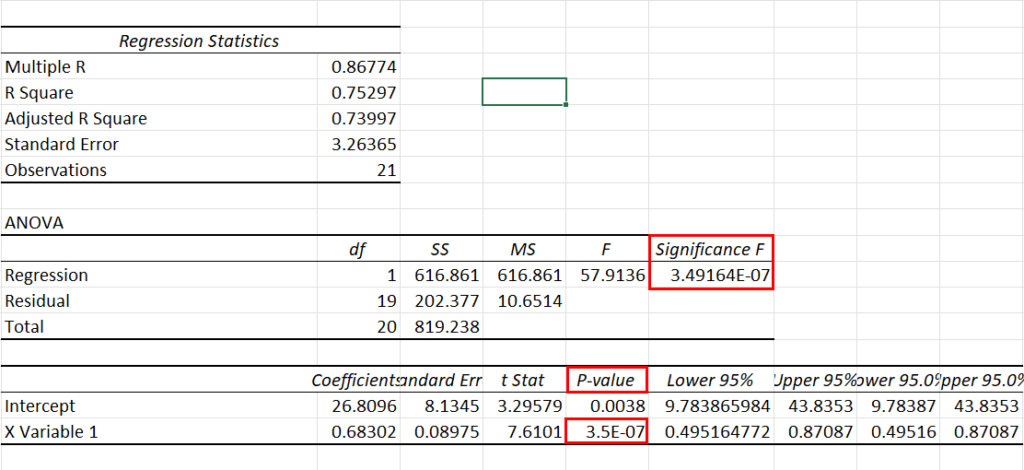
You’ll see a Regression analysis chart as shown above. In the screenshot, I’ve highlighted the cells where you’ll find the p-value.
The p-value calculated in this example is 0.0000003. This is far lower than the alpha value of 0.05. It indicates that the null hypothesis doesn’t stand. There’s a correlation between the grades obtained in all the subjects of science and individual grades in math.
Using t-Test
If you wish to perform advanced t-Test on Excel you can use various t-Test tools available in the Data Analysis ToolPak add-in.
Follow the steps mentioned earlier to bring up the Data Analysis dialog.
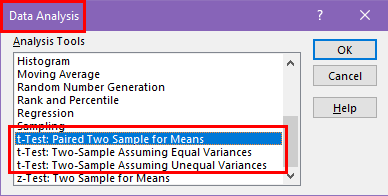
Scroll down to find three different types of t-Tests you can choose from.
Let’s go ahead with the t-Test: Paired Two Sample for Means. Click OK to bring up the dialog box.
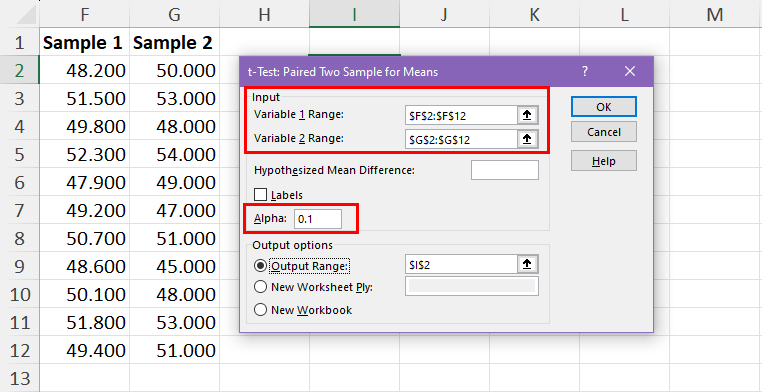
Enter the sample dataset ranges in the Variable 1 Range and Variable 2 Range fields.
Enter the significance level you’re aiming for in the Alpha field.
Select the Output Range and choose a cell as the destination for the results.
Click OK to perform the t-Test.
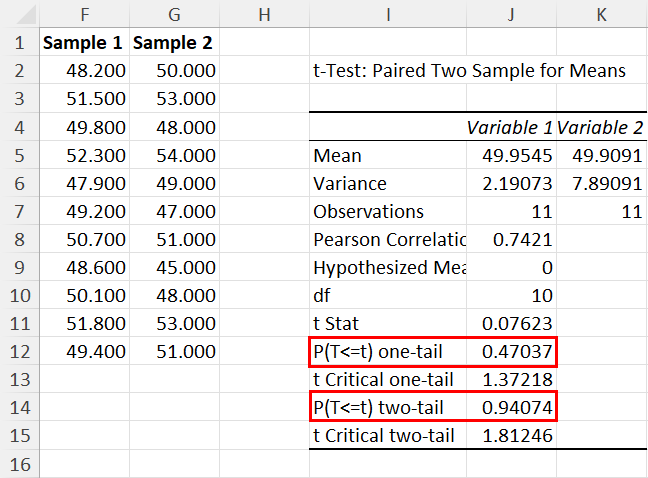
I’ve highlighted the cells in the above screenshot where you should find the p-values.
Find P-Value Using Excel VBA
Suppose, you find it challenging to remember various formula syntaxes and arguments of Excel functions. Or, you’d like to automate the task of finding the p-value using a programmatic method. In both scenarios, you can use Excel VBA.
You can create a VBA macro using the following script:
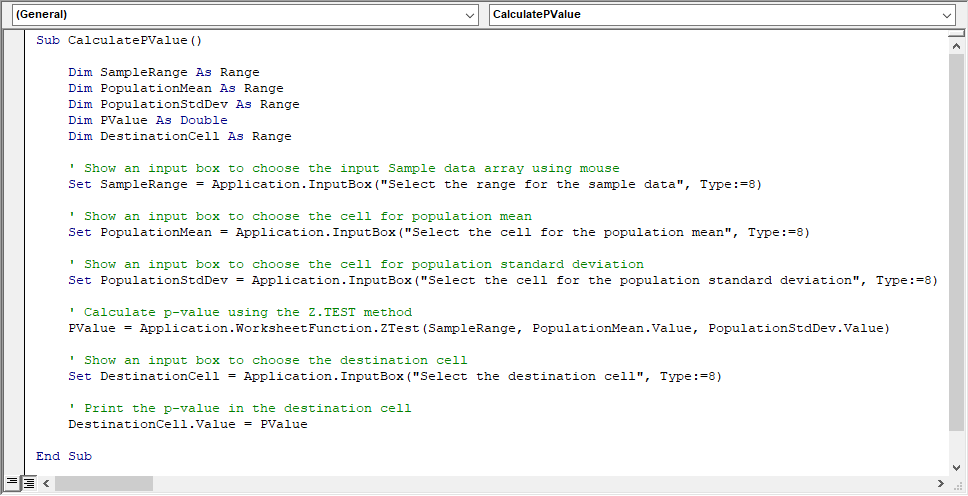
Sub CalculatePValue()
Dim SampleRange As Range
Dim PopulationMean As Range
Dim PopulationStdDev As Range
Dim PValue As Double
Dim DestinationCell As Range
' Show an input box to choose the input Sample data array using mouse
Set SampleRange = Application.InputBox("Select the range for the sample data", Type:=8)
' Show an input box to choose the cell for population mean
Set PopulationMean = Application.InputBox("Select the cell for the population mean", Type:=8)
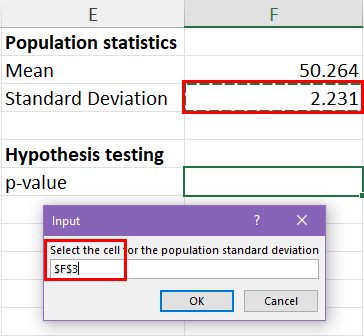
' Show an input box to choose the cell for population standard deviation
Set PopulationStdDev = Application.InputBox("Select the cell for the population standard deviation", Type:=8)
' Calculate p-value using the Z.TEST method
PValue = Application.WorksheetFunction.ZTest(SampleRange, PopulationMean.Value, PopulationStdDev.Value)
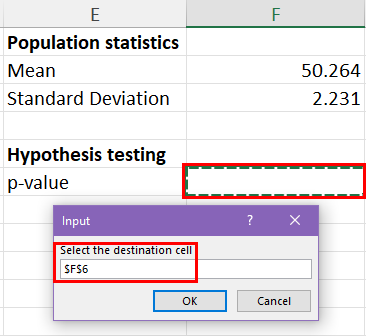
' Show an input box to choose the destination cell
Set DestinationCell = Application.InputBox("Select the destination cell", Type:=8)
' Print the p-value in the destination cell
DestinationCell.Value = PValue
End Sub
To learn the steps to create a VBA macro using a VBA script, read this Excel article now:
📒 Read More: How To Use The VBA Code You Find Online
The above script visually guides you to calculate p-values using the Z.TEST function.
You shall see the following prompts if you ruin the macro:
- Input box for the sample dataset
- Prompt for the population mean
- Input box for the population standard deviation
- Prompt for destination cell range
When you go through the above steps, Excel calculates the p-value in the selected cell.
If you wish to calculate the p-value with the t-Test, use the following script:
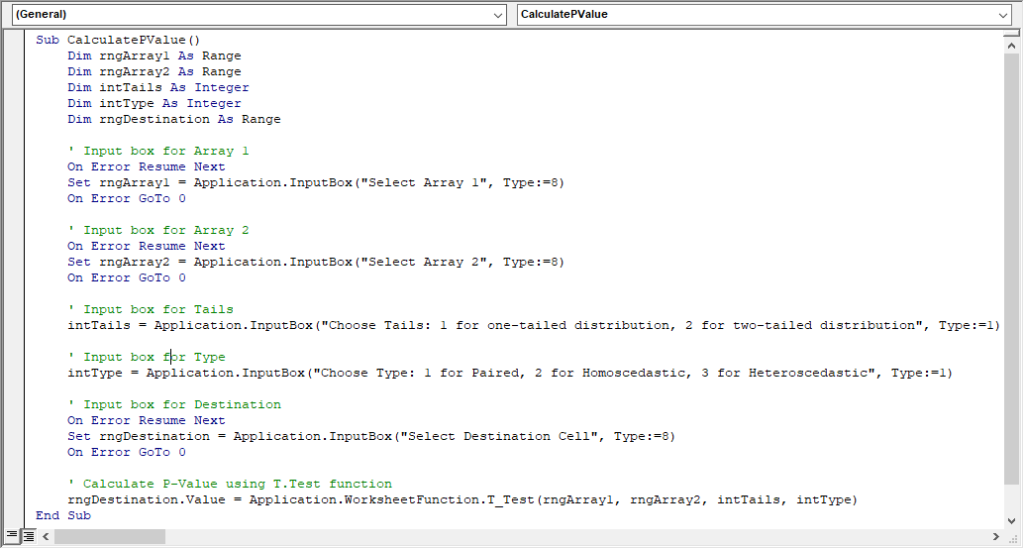
Sub CalculatePValue()
    Dim rngArray1 As Range
    Dim rngArray2 As Range
    Dim intTails As Integer
    Dim intType As Integer
    Dim rngDestination As Range

    ' Input box for Array 1
    On Error Resume Next
    Set rngArray1 = Application.InputBox("Select Array 1", Type:=8)
    On Error GoTo 0

    ' Input box for Array 2
    On Error Resume Next
    Set rngArray2 = Application.InputBox("Select Array 2", Type:=8)
    On Error GoTo 0

    ' Input box for Tails
    intTails = Application.InputBox("Choose Tails: 1 for one-tailed distribution, 2 for two-tailed distribution", Type:=1)

    ' Input box for Type
    intType = Application.InputBox("Choose Type: 1 for Paired, 2 for Homoscedastic, 3 for Heteroscedastic", Type:=1)

    ' Input box for Destination
    On Error Resume Next
    Set rngDestination = Application.InputBox("Select Destination Cell", Type:=8)
    On Error GoTo 0

    ' Calculate P-Value using T.Test function
    rngDestination.Value = Application.WorksheetFunction.T_Test(rngArray1, rngArray2, intTails, intType)
End Sub
You just need to create a VBA macro using the above script.
Then, the VBA script input boxes shall visually guide you through the process.
⚠️ Warning: Excel VBA doesn’t allow the use of Excel undo features to revert back to the original workbook structure. So, create a backup copy of the workbook before running any VBA macros.
Conclusions
Before going through this Excel tutorial, if you thought calculating p-value in statistical analysis was a complex tax, your perception should have changed by now. So far, you must have learned that it’s pretty easy to find the p-value of a statistical experiment to disprove or establish a null hypothesis. All you need to do is follow the manual and automatic methods mentioned above.
Did the article help you to clear your doubts about p-value or probability value calculation in Excel? Comment below!


 👉 Find out more about our Advanced Formulas course!


0 Comments