Learn how to find Z-score in Excel in this quick and easy-to-remember Microsoft Excel tutorial.
Excel offers more than 100 statistical analysis functions. One such is Z-score analysis which enables you to perform important tasks like dataset standardization, outlier detection, normality assessment, hypothesis testing, and so on.
In this Excel tutorial, I’ll explore diverse methods for calculating Z-scores. From manual calculations to leveraging built-in functions, array functions, and even automatic techniques, you’ll gain proficiency in every approach. Follow along until the end of the article to master these tried-and-tested methods and acquire a valuable Excel skill set.
What Is Z-Score?
The Z-score is a statistical measure that quantifies the number of standard deviations a data point is from the mean of a dataset. It’s a way of standardizing data so that you can compare different datasets on a common scale.
The formula for calculating a Z-score is:
Z = [X (data point in the dataset) - µ (mean of the dataset)] / σ (standard deviation of the dataset)Z-scores are particularly useful in understanding the relative position of a data point within a distribution. A positive Z-score indicates that the data point is above the mean, while a negative Z-score indicates that the data point is below the mean. The magnitude of the Z-score tells you how far away from the mean the data point is in terms of standard deviations.
Find Z-Score in Excel Using Manual Calculation
You can use the Z-score equation explained earlier to calculate its value easily.

Firstly, you must organize your statistical analysis dataset as shown above. The must-vase elements of the worksheet are as outlined below:
- Column of the input dataset: For example, the Birth Weight (kg) column header in this example.
- Column for Z-scores: Create another column named Z-Score where you’ll enter the manual Z-score formula.
- A calculated cell for mean: Here, you’ll calculate the mean of the entire dataset you’re analyzing.
- A calculated cell for standard deviation: Create another cell where you’ll calculate the standard deviation of the input dataset.
I’ll use this data structure throughout this Excel tutorial.

Once you’ve organized your raw dataset into the above format, go to the cell below the Mean column and type this formula. Hit Enter to calculate.
=AVERAGE(B2:B16)
Similarly, go to the cell where you want the standard deviation value, and enter this formula:
=STDEV.P(B2:B16)Hit Enter to execute the formula.

Now, select the first cell below the Z-score column header and enter the following formula:
=(B2-$D$2)/$E$2In the above formula, B2 is x, a data point from the dataset. You must subtract the mean value of the dataset from x, which is $D$2. Finally, You’ll need to divide the result by the standard deviation of the dataset, which is $E$2.
Now, you can use the above information to customize your manual Z-score formula.
Once done entering the formula in the desired cell, press Enter to calculate the Z-score for the selected data point.

Then, drag the fill handle down the column to generate Z-scores for the rest of the data points of the dataset.
This method is suitable for any Excel desktop and web app editions.
Find Z-Score in Excel Using STANDARDIZE Function
If you’re on any of the following or a better Excel desktop or web app, you can use the STANDARDIZE function to find the Z-score in Excel:
- Excel 2013
- Excel 2019 for Mac
- Excel for the web
Before you can use this function, calculate the Mean and Standard Deviation for your statistical analysis dataset. Also, create a column for Z-score to the right of the data points of the dataset.

Now, select the cell where you must calculate the Z-score for the first data point and enter the following formula:
=STANDARDIZE(B2,$D$2,$E$2)Don’t forget to press Enter to calculate the field.

Now, use the fill handle to copy the formula and fetch the Z-scores for the rest of the data points.
Find Z-Score in Excel Using PivotTable
Suppose, you’re already analyzing a dataset in a PivotTable. You can use the same interface to calculate the Z-score.

For instance, you’ve got the above dataset where you must calculate the Z-score for the Avg Weight (Kg) values of various countries.
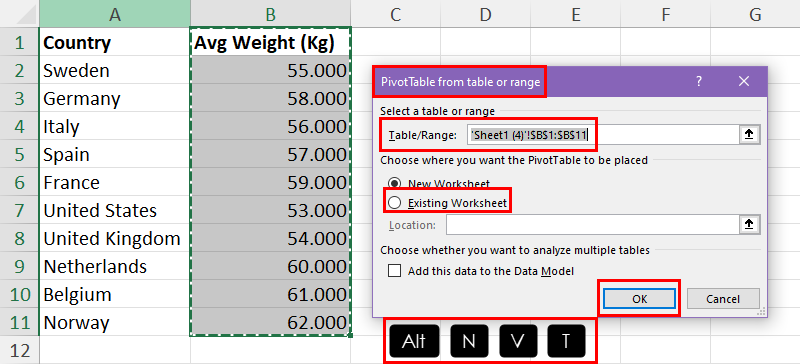
Select the dataset of the Avg Weight (Kg) column and press Alt + N + V + T to bring up the PivotTable from table or range dialog.
Here, click the Existing Worksheet option and select a cell on the active worksheet. Click OK to start creating the PivotTable.

You shall now the PivotTable Fields console on the right side of the Excel app.

Now, drag and drop the Avg Weight (Kg) to the Rows field on the PivotTable Fields console.
Again, drop the Avg Weight (Kg) to the Values field.

Click on the Avg Weight (Kg) drop-down in the Values field and choose Value Field Settings from the context menu.
On the Summarize Values By tab, choose Average and click OK.
Again, insert Avg Weight (Kg) into Values and bring up the Value Field Settings dialog by following the steps mentioned above.

Now choose StdDevp in the Value Field Settings dialog and click OK to apply it.

So far, you’ve created a PivotTable that shows the input data points under the Row Labels column, the mean of the dataset in the Grand Total row of the Average of Avg Weight (Kg) column, and the standard deviation for the same dataset in the Grand Total row of the StdDevp of Avg Weight (Kg) column.

Now, click anywhere on the PivotTable and press Alt + JT + J + F to bring up the Insert Calculated Field dialog.
Here, set the following as outlined below:
- Name: Z-Score
- Formula:
=('Avg Weight (Kg)'-57.5)/2.872(this is the same formula for Z-score as I’ve explained in the first method)
Now, click OK on the dialog box to create a new calculated field.

You’ve got your Z-scores in the new calculated field column of the PivotTable.
Find Z-Score in Excel Using Excel VBA
If you like to code in Excel using VBA, you’ll definitely want to try this method. Also, this is a great method to find the Z-score with visual instructions.
Find below a simple VBA script that’ll guide you through calculating the Z-score from an input dataset:

Sub CalculateZScores()
    Dim InputRange As Range
    Dim OutputRange As Range
    Dim Cell As Range
    Dim Mean As Double
    Dim StdDev As Double
    Dim ZScore As Double

    ' Prompt user to select input data range
    On Error Resume Next
    Set InputRange = Application.InputBox("Select the input data range:", Type:=8)
    On Error GoTo 0

    If InputRange Is Nothing Then
        MsgBox "No input range selected. Exiting."
        Exit Sub
    End If

    ' Prompt user to select output range
    On Error Resume Next
    Set OutputRange = Application.InputBox("Select the destination for Z-scores:", Type:=8)
    On Error GoTo 0

    If OutputRange Is Nothing Then
        MsgBox "No output range selected. Exiting."
        Exit Sub
    End If

    ' Calculate mean and standard deviation
    Mean = WorksheetFunction.Average(InputRange)
    StdDev = WorksheetFunction.StDev(InputRange)

    ' Calculate Z-scores and write to output range
    For Each Cell In InputRange
        If StdDev <> 0 Then
            ZScore = (Cell.Value - Mean) / StdDev
            OutputRange.Value = ZScore
            Set OutputRange = OutputRange.Offset(1, 0)
        Else
            MsgBox "Standard deviation is zero. Cannot calculate Z-score."
            Exit Sub
        End If
    Next Cell

    ' Display completion message
    MsgBox "Z score calculation completed!"
End Sub
You can use the above script as is without making any cell range modifications. The script shall scan through the referred dataset to calculate the Z-score and print the result into the destination cell range.
To learn how to create a VBA macro using the above script, read this quick Excel VBA guide:
📒 Read More: How To Use The VBA Code You Find Online
To run the macro, press Alt + F8, choose the CalculateZScores macro, and click on the Run button.

When you get the input box to select the dataset, use the mouse to highlight the target data points.

Next, you’ll get another prompt to choose the destination cell range.

As soon as you respond to the above input boxes, Excel will calculate the Z-scores.
⚠️ Warning: Create a copy of the original workbook before running this VBA macro to calculate the Z-score. When you use VBA, you can’t revert back to the original state of the dataset using the Excel undo feature.
Conclusions
If you find calculating a Z-score at school or work a challenging task, it’s not anymore if you’ve learned the methods explained so far.
Here, I’ve explained simple methods to programmatic ones so you can suit your Excel expertise level.
Share your suggestions, tips, or feedback below if you liked or disliked the article.


 👉 Find out more about our Advanced Formulas course!


You should probably use the sample standard deviation, STDEV.S, to calculate Z scores, rather than the population standard deviation, STDEV.P, unless you know all the birth weights, not just a sample of them. You should also be doing some kind of weighting of the statistics, since each country has a different number of births.
Probably true, but I think the difference is N vs N-1 in the formula so as N gets larger they converge to the same value.